Section 9: Highly Fractionated Designs
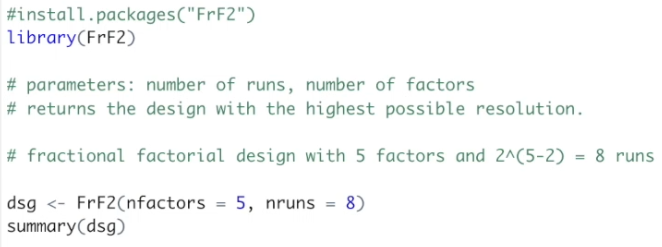
Let’s start by building the fractional design of the previous video, 2(5-2), using as arguments the number of factors and the number of runs. It will return the design with the highest possible resolution. We are creating the design dsg by using the FrF2 function. The arguments are the number of factors, five, and the number of runs, eight. To view the design, we are going to use the summary function.
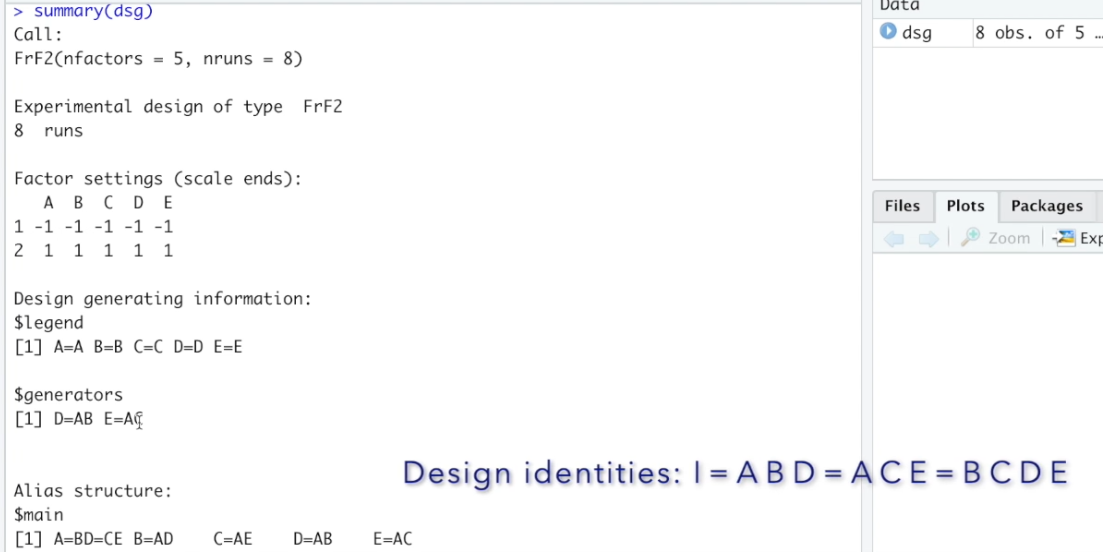
So, this is a resolution III design, where main factors are aliased to two-factor interactions, and the two-factor interactions are aliased to each other. The alias structure shows exactly this. The main factor A is aliased to BD and CE, the main factor B with AD, C with AE, D with AB, and E with AC. And the two-factor interactions: BC with DE and BE with CD. Finally, we have the design itself: the combination of the low and high levels of the five factors A, B, C, D, and E.
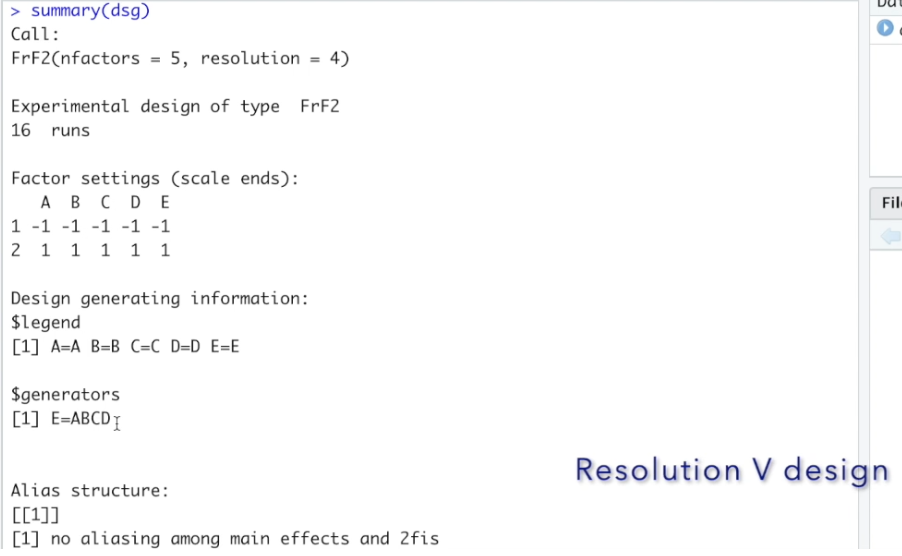
And finally, we can see the design itself. The 16 runs are the combination of the low and high levels of factors A, B, C, D, and E. However, how can we use this design outside R? To view the design as a table, we can use the view function. And here we have the design, now shown as a table and not in the console. To export design, we can use the write.csv function. But first, we need to set where we are going to save it. To do it, we're going to click the tab files and select the folder where we would like to save. I have mine already selected. Then we are going to click on the little gear on the right side, and "set as working directory." The arguments of the write.csv function are the object we are saving, in this case, the dsg, and the name of the file. Let's run it. Now we can see the design saved as a CSV file. You can use MS Excel, MacOS Numbers, Google Sheets, or any other software to open, edit, and write over it right. In our next lesson, we are going to look into how to solve a highly fractionated design. Take care and see you shortly.