Section 7: Blocking a Factorial Design
 Let's start running the regression model with the coded variables. We are taking into account all factors and interactions that were significant in the analysis of variance.
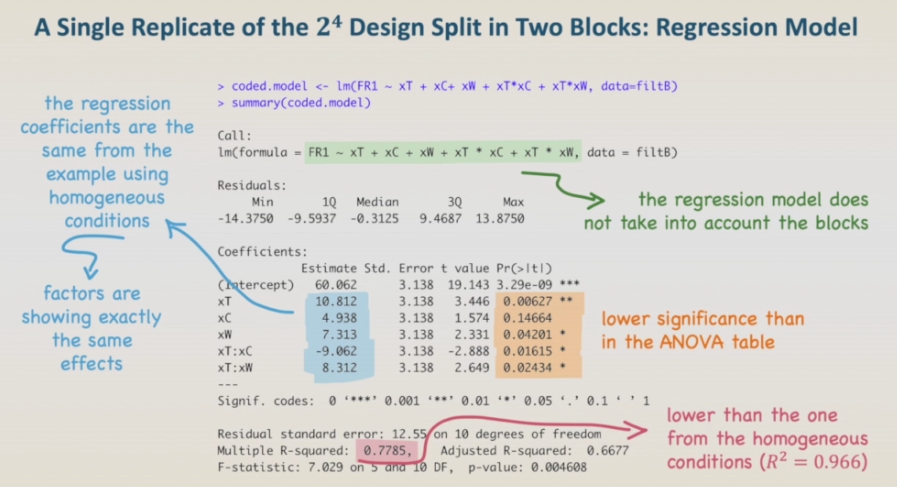 The results of the coded model shows that the regression coefficients for the coded variables as the same from the example using homogeneous conditions. The fact that we have split the design in blocks and that the blocks are significant hasn't affected the analysis; we can see exactly the same effects. However, the p-values show that the regression coefficients are less significant than the factors in the ANOVA table, and are also less significant than the results in the homogeneous conditions. In addition, the R-squared of 0.7785 is lower than the one from the homogeneous conditions, that was 0.966. This is happening because the regression model does not take into account the blocks. And it couldn't. Unlike fixed factors, as temperature, pH, concentration, type of enzyme, stirring rate and so on, the effect of the blocks is not constant and can not be predicted by a model. The effect of the blocks comes from nuisance variables that we cannot control. As a result, the R-squared is too low to build contour plots. The model explains only 77.8 % of the data variability.
There is not a fixed threshold of R-squared to build contour plots. I would say that over 0.9 or 90 % we are in the safe zone; between 0.8 and 0.9 we have to think twice. Maybe there are better ways of showing the results. And below 0.8 I would not use contour plots once they don’t show how far the experimental points are from the predicted contour lines, and the contour lines have a low representation of the behaviour of the system. If we can not use contour plots, which type of graphs can be used to illustrate the results? In this particular case, I would suggest bar graphs.