Section 7: Blocking a Factorial Design
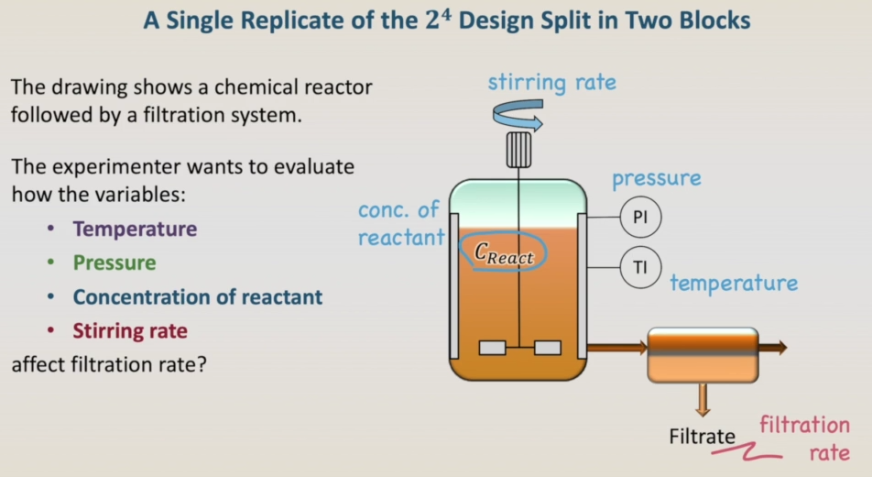 To illustrate the use of blocks in a 2k design Let's use the example of the single replicate of a 24 design that we have already analyzed, and split it in two blocks. The drawing shows a chemical reactor followed by a filtration system. The experimenter wants to evaluate how the variables, temperature, pressure, concentration of reactant, and stirring rate affect the filtration rate. Each factor is being tested at two levels each: a low level and the high level.
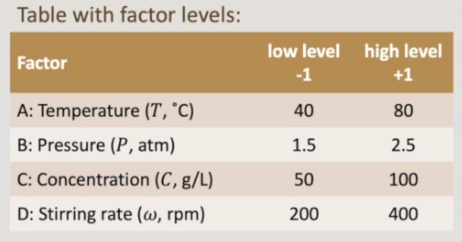 The temperature, factor A, 40 and 80 degrees. The pressure, factor B, one point five and two point five atmospheres. The concentration, our factor C, 50 and 100 grams per litre, and the stirring rate, 200 and 400 rpm. The concentration, our factor C, 50 and 100 grams per litre, and the stirring rate, 200 and 400 rpm.
A typical 24 design involves 16 different treatments that are the combination of the low and high levels of the design factors temperature, pressure, concentration and stirring rate, as shown in the table on the left. Let’s now suppose that one batch of raw material is not enough to run all the 16 runs. So we have to split the 16 runs within two batches of raw material, assigning eight runs to each batch and creating a two in the power of four design confounded in two blocks. As a general rule, we will always confound the highest-order interaction with the blocks. In this case, the four-factor interaction ABCD. We are going to assign the treatments to the blocks by making the contrast of the blocks being equal to the contrast of the four-factor interaction ABCD. Let’s now create a column for the factorial effect ABCD. Let’s now create a column for the factorial effect ABCD. The signs for the factorial effect ABCD are given by the multiplication of columns A, B, C and D. For treatment (1), for example, minus times minus times minus times minus is a plus and the same applies for the other treatments.
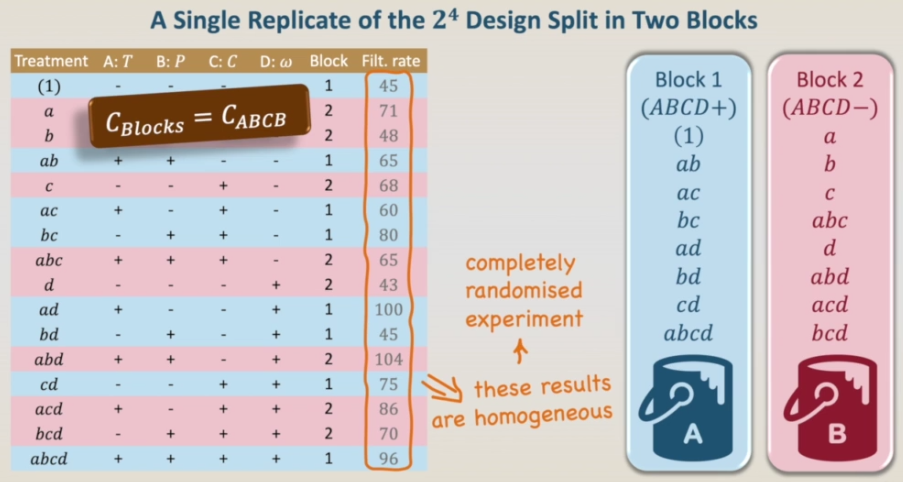 Now, let’s create a column for the blocks and we are going to assign to block one all treatments that have a plus sign in the ABCD column: treatments (1), ab, ac, bc, ad, bd, cd and treatment abcd. (1), ab, ac, bc, ad, bd, cd and treatment abcd. (1), ab, ac, bc, ad, bd, cd and treatment abcd. (1), ab, ac, bc, ad, bd, cd and treatment abcd. (1), ab, ac, bc, ad, bd, cd and treatment abcd. (1), ab, ac, bc, ad, bd, cd and treatment abcd. And for block two, all the treatments that have a minus sign in the ABCD column: treatments a, b, c, abc, d, abd, acd, and bcd. Now the contrast of the blocks are equal to the contrast of the four-factor interaction ABCD. However, the results that we have in the table as the same from the previous example, they are homogeneous and obtained in a completely randomized design. The blocks won’t have any effect. So let’s add a little fun and let’s introduce an effect for the blocks.
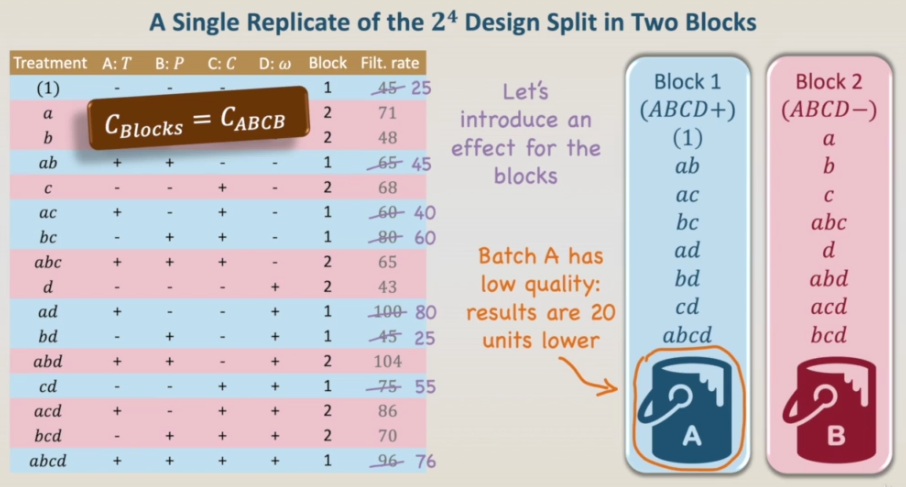 Imagine that batch A is of low quality and the results are 20 units lower. This way we are going to reduce by 20 units all the results from the treatments of block 1. And then we have our final results to analyze. We are going to use R to analyze this 2ˆ4 design, confounded in blocks. Please download the csv file for the data, the txt file for the R code. and let’s change to R.