Section 3: Factorial Designs
After that analysis of variance, the next step is to compare the treatment means using Tukey’s test. The table already shows final result as mean and standard deviation of the battery life for each treatment. Tukey’s test compares the difference between two means to a limit value T-alpha to state if they are significantly different or not. The limit value T depends on the significance level, the number of treatments, the degrees of freedom of the error, the mean squares of the error and the number of replicates. The q-value can be read in a specific table, as we have already seen. This way, our calculated T-value is 61.9.
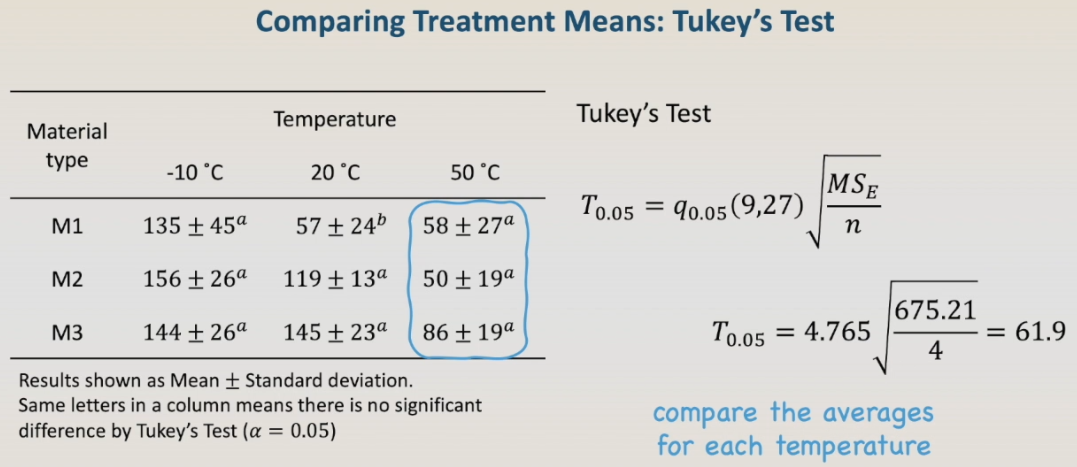 Now we are going to compare the results for each temperature to decide if the behavior of the materials differ or not. At -10℃, the battery life is similar for all materials, since the difference between them is lower than 61.9. At 20℃, material 1 has a shorter battery life than materials 2 and 3; and that 50℃, again, there is no difference between the materials. It is pointless to compare the temperature within the materials, since we have no control over it, we cannot choose the best temperature, we can only choose the best material. And finally, we are ready to draw conclusions.
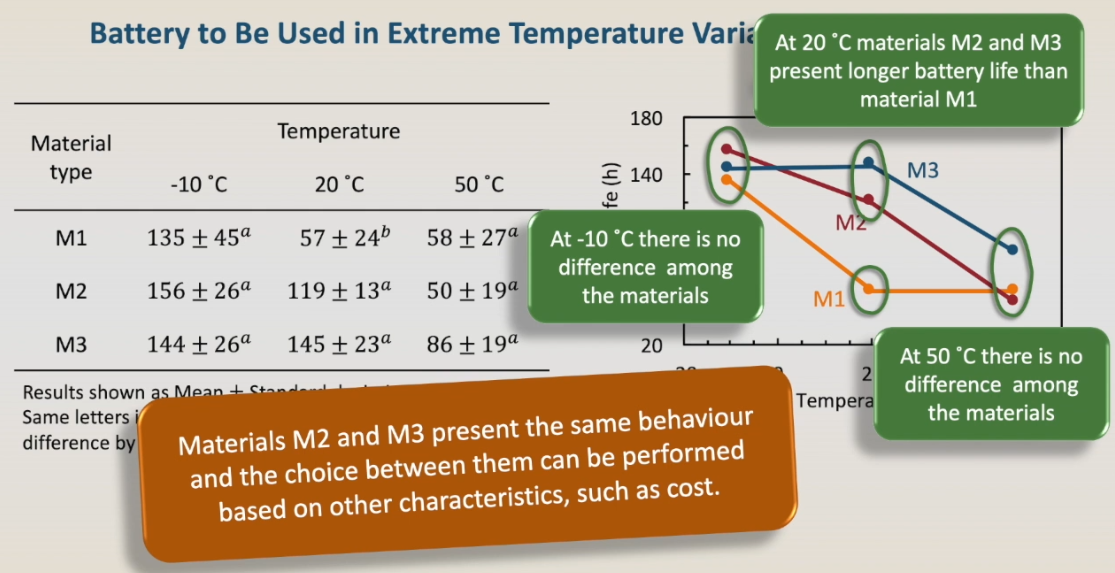 At -10℃ there is no difference among the materials; at 20℃ materials 2 and 3 At -10℃ there is no difference among the materials; at 20℃ materials 2 and 3 present longer battery life than material 1, and that 50℃ also there is no difference among the materials. also there is no difference among the materials. Our final conclusion materials two and three present the same behavior and the choice between them can be performed based on the other characteristics, such as cost.