Section 3: Factorial Designs
Let’s take a look in this example of a Two-Factor factorial design. A researcher needs to design a battery to be use in extreme temperature variations. There are three choices of materials to be tested. Once the batteries in use, there is no control over the temperature that the device will encounter. And it is well known that the temperature affects effective battery life. The battery should be robust to temperature variation. The following questions must be answered. What effect the material type and temperature have on the life of the battery? And is there a choice of material that would give uniformly long life despite the temperature? The table shows the factorial design performed. This is the simplest type of crossed factorial design since it involves only two factors. Factor A tested at a levels. Factor B test at b levels. Each replicate of the experiments contains all ab treatment combinations, and there are n replicates.
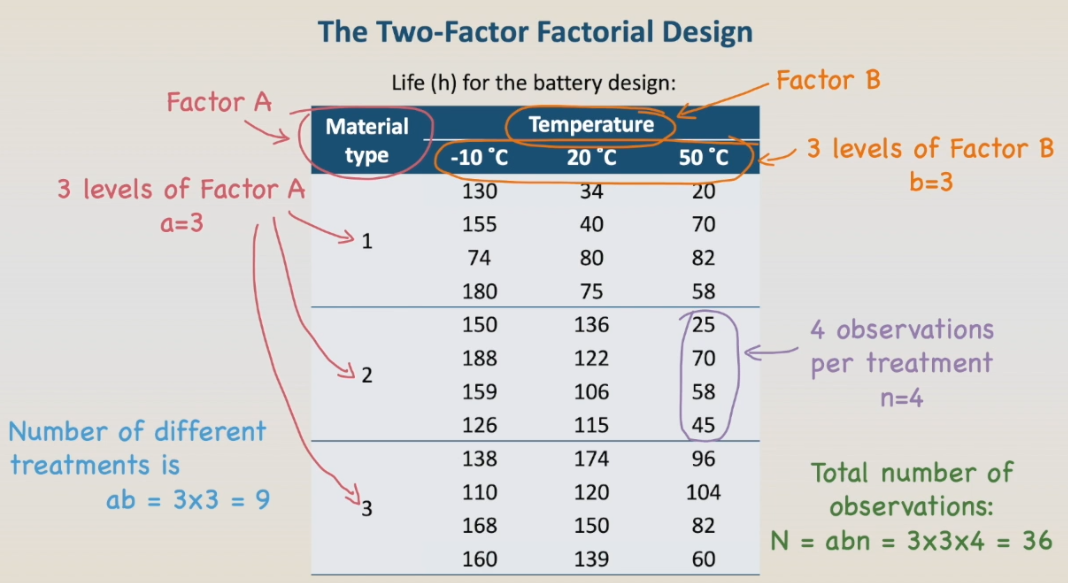 In our case, the material type is factor A. tested at three levels each. The temperature is our factor B, also tested at three levels each. The number of different treatments is nine. We have four observations per cell, the number of replicates is 4, and the total number of observations is 36. The order that the abn observations are taken is selected at random: This is a completely randomized design. In the same way of the one-way ANOVA, we can use the effects models to describe the experimental observations. In this case each individual result $y_ijk$ can be described by the overall mean, plus the effect of factor A, plus the effect of factor B, plus the effect of the interaction AB plus a random error.
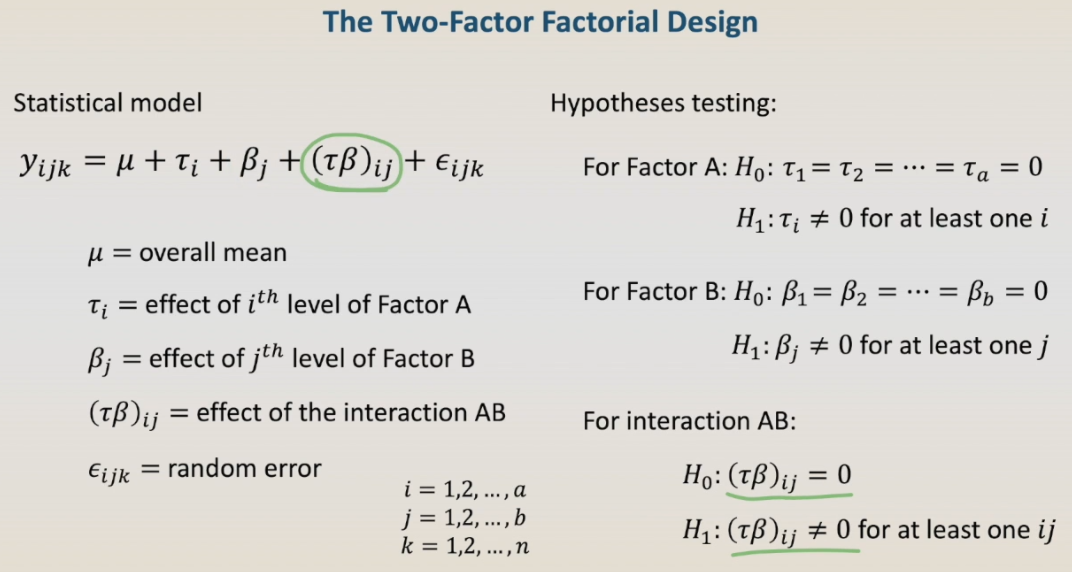 The analysis of variance will test the effects of A, B, and the interaction AB. So the analysis of variance table presents the total variability of the data split into the variability of factor A, factor B, and the interaction. In our particular case, material, temperature and the interaction between material and temperature. Each one of these sources of variations will be compared to the error by using the F-test, that is the ratio between the mean squares of a factor or interaction and the mean squares of the error. In this slide we have the computing formulas for the two-factor ANOVA and the mean squares of the error. In this slide we have the computing formulas for the two-factor ANOVA But we’re using Excel to calculate them. Please download the file MS Excel BatteryLife, and verify that the data analysis toolpack is already installed in your Microsoft Excel.