series: “Section 1: Introduction - do the Design of Experiments”
Now, going back to our initial problem: the results from an experiment are considered as a sample of the population. From the data we know that the sample mean of the unmodified formulation is slightly higher than the sample mean from modified one. However, the observed difference in the average results is due to the polymer addition or is due to the noise the system? In other words, is the difference significant? To answer this question, we are going to use a statistical technique called hypothesis testing. We are going to test two hypothesis: The null hypothesis, H0, that states that the means are equal, in our case, that the polymer addition does not affect the strength. And the alternative hypothesis, H1, that states that the means are different, in our case, the polymer addition does affect the strength.
Suppose that we can assume that the variances of the tension bond strength are the same for both formulations, then the appropriate statistical test to compare them is the two-sample t-test.
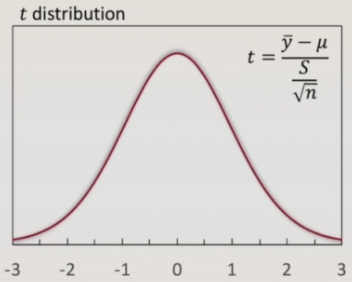 The quantity t0 is calculated using the sample means and variances, and then compared to the t-distribution curve.
The null hypothesis will be considered true, meaning the means are equal if the absolute value of t0 is smaller than a critical t. For a significance level alpha, For a significance level alpha, it is expected that $100(1-\alpha)$% of t0 values to fall between minus t-critical -t$\alpha$/2, n_1+n_2-2 and plus t-critical +t$\alpha$/2, n_1+n_2-2. The values of t-critical can be read in a table using the significance level and the number of observations. However, as we are going to use statistical software for our analysis, we are not going to use tables.
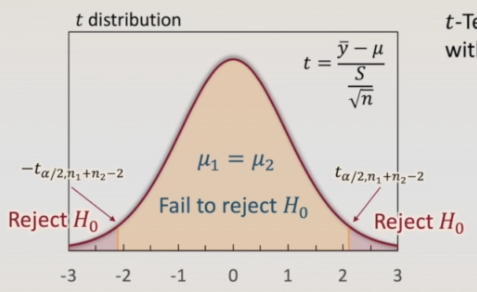 This new term, the significance level alpha, is the probability of type I error, that is the probability of rejecting the null hypothesis when it is true. In our example, the probability of stating that the polymer does affect the result when it does not. We usually set alpha at 0.05 or 5%.
And now one last detail before analyzing the two formulations of our example. The two-sample t-Test is applied for samples with equal variances. So we are going to check if the variances are equal or not. And the appropriate way is by using the F-test. Consider that we have a random sample of apples from Farm 1, with $n_1$ observations and variance $S_1$ to the square ($S_1^2$), and a random samples from Farm 2, with $n_2$ observations and variance $S_2$ to the square ($S_2^2$). If the two populations of apples from the two farms have the same variance, then $\sigma_1^2$ = $\sigma_2^2$, $\sigma$ (sigma) is the variance of the populations, and the ratio between the two sample variances follows an $F_{n_1-1, n_2-1}$(F-distribution for $n_1$ minus 1 and $n_2$ minus 1 degrees of freedom). In practice, we are going to consider that the null hypothesis is true, meaning the variances of the populations are equal, if the ratio between the sample variances is lower than a critical F. In the same way of the t-Test, the values of the critical F can be read in the F-distribution tables for each significance level by crossing the degrees of freedom of the two samples.
Now we have everything we need to compare the two formulations. We are going to use Microsoft Excel for this analysis. Please download the Microsoft Excel file cement and let’s change to Microsoft Excel to start the analysis.