Let’s start the analysis of the 2^2 design, with replicates and blocks by loading the experimental data from the csv file the experimental data from the csv file.
In this file, we have the natural variables, substrate and enzyme, the coded variables, xS for substrate and xE for the enzyme, the yield, our response variable, and the blocks, with block one, block two and block three. Let’s see the file structure by using the STR function.
In the file structure we see that we have 12 observations of six variables and all the variables are numerical: blocks, substrate, enzyme, xS, xE and yield.
For the analysis of variance, we need the variables defined as factors. So let’s create them. In these lines, we have the creation of the variables Factor_S and Factor_E as factors using the coded variables xS and xE for their levels. And in the third line we are transforming the variable blocks from numerical to factor, and not creating a new variable. For the substrate and the enzyme we are creating new variables because we need the original ones as numerical for the regression models. However, we don’t use blocks in the regression model. It doesn’t make sense as you are not able to repeat a specific block. We cannot choose the best block conditions and run them again. Moreover, we haven’t even identified any potential source of variability among the blocks or replicates. If the blocks are significant, we probably won’t know why. So let’s run it.
Now, our data file has two new variables, Factor_S and Factor_E, and these new variables Factor_S and Factor_E are factors with two levels each, and the block variable, the block column, is also a factor, with three levels each. is not numerical anymore.
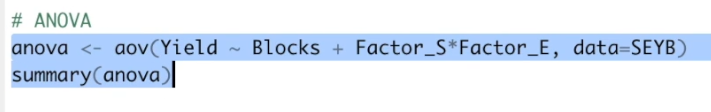 Now we are ready for `the analysis of variance`. In the analysis of variance we have the yield, our response, as a function of the blocks plus Factor_S times Factor_E The star means that Factor_S, Factor E, and the interaction between them will be tested. So let's run it.
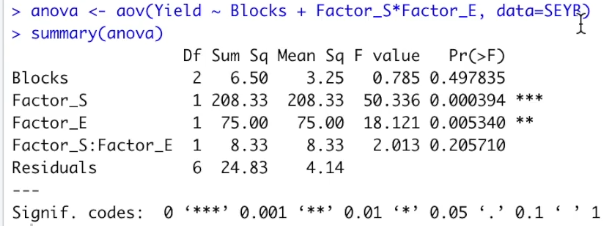 Here we have the resulting ANOVA table. We are going to transfer these results to the presentation to analyze them.
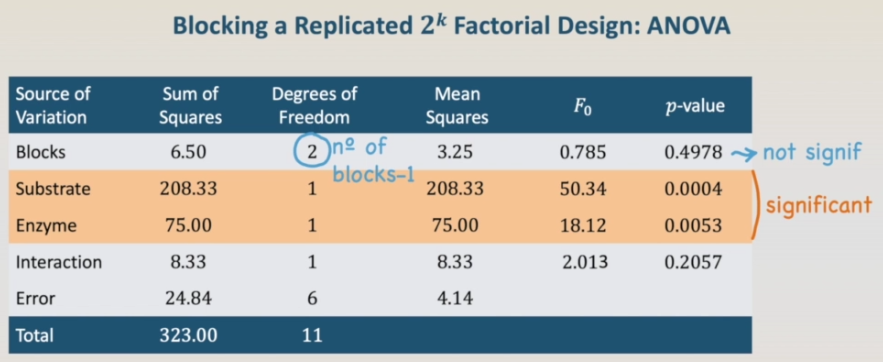
Then table shows the sum of squares, the degrees of freedom, the mean squares, the F-zero and the p-value for the substrate, the enzyme, the interaction the error and for the blocks.
In this case, substrate and enzyme are significant. The same result that we have previously. Looking for the blocks, the degrees of freedom of the blocks is two, the number of blocks, three, minus one. Looking for the blocks, the degrees of freedom of the blocks is two, the number of blocks, three, minus one. And the p-value shows that the blocks are not significant. It is kind of expected that the blocks were not significant.
 In fact, we have used the same data of the completely randomized design split into blocks. We could use an artificial block effect to analyze it. But we are not doing it now. They're going to do it for the next example. A factorial design confounded in blocks. The next steps would be to build the regression model, to check the model adequacy and to build the contour plots. However, we have already done it previously. So we won't do it again. Anyway, the code needed is in the txt file. Feel free to run it before continuing in our next lesson.