Here we have the resulting analysis of variance table for the effects of the temperature and material on the battery life. We have the sources of variations, sum of squares, the degrees of freedom, the mean squares, the F-zero, the critical F and the p-value for the material, the temperature and the interaction between them. To remember, a factor or interaction is significant F-zero is higher than the critical F, meaning that the p-value is lower than the significance level alpha, usually 0.05. Before going further, it is important to point out that the critical F is not the same for all the tests. This is because of the different degrees of freedom of each term. The analysis of variance will help us to answer the following questions:
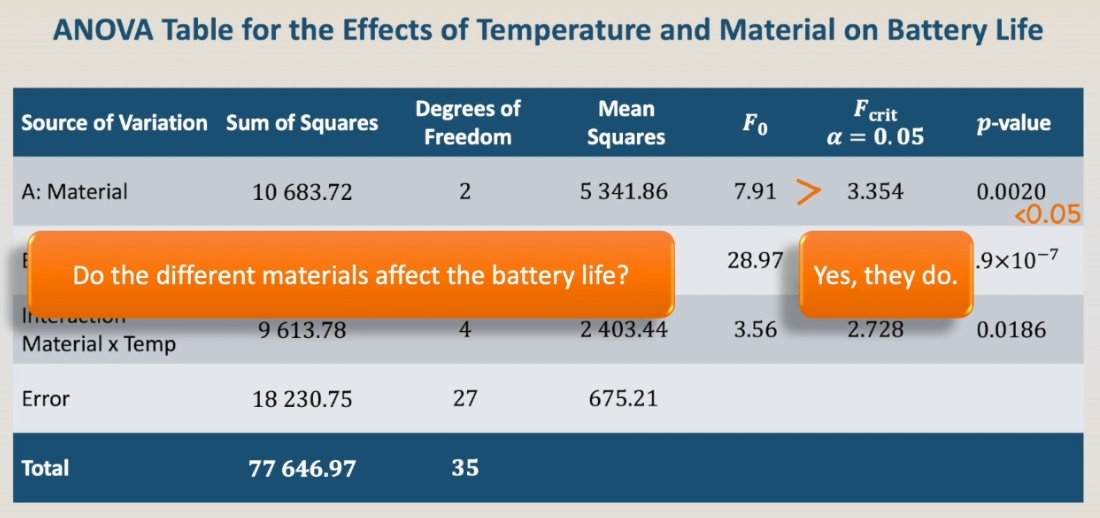 first, do the different materials affect the battery life? And the answer is yes, they do. F-zero is higher than F critical, and p-value is lower than 0.05.
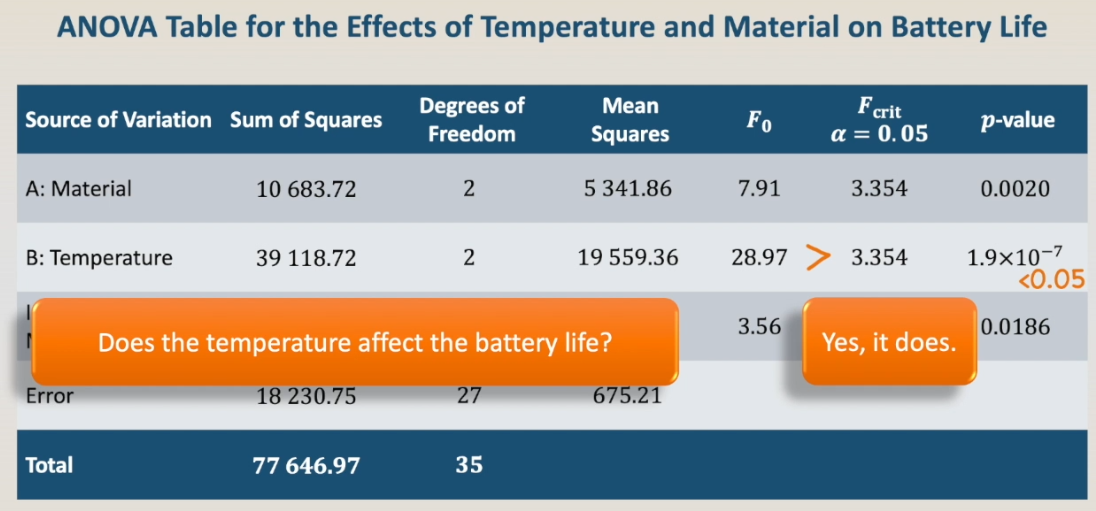 Second question, does the temperature affect the battery life? And again, the answer is yes it does. However, we already knew it from the statement of the problem. It is well known that the temperature affects the effective battery life.
 The real question here is the following: Is there a choice of material that would give us uniformly long-life, despite the temperature? This way, the test with temperature, was not to see if the temperature affected the battery life, but to see if the effect of the temperature on the battery life was different for different materials.
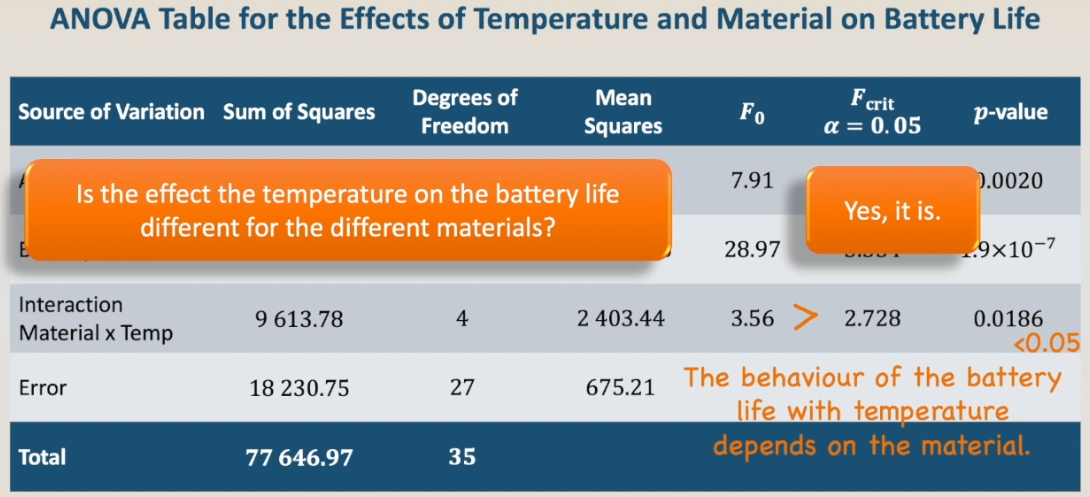 And the answer and again is: Yes, it is. The behaviour of the battery life with temperature depends on the material. To visualize this behaviour, we have the final results presented as a table, with mean and standard deviation, And as a plot.
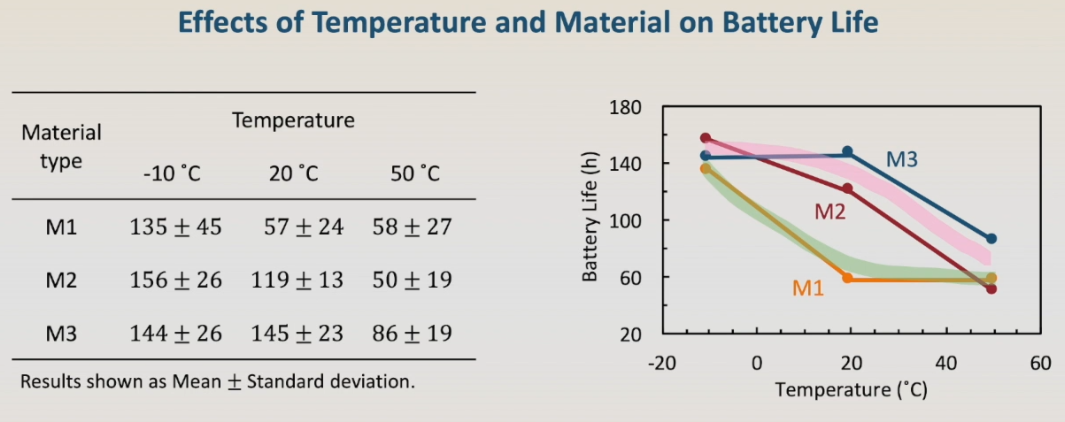 In the graph, it is easy to visualize that the battery life decreases with temperature for all materials, but the behavior is different and for material 1 compared to materials 2 and 3.
22 Interpretation of the Results