After performing the analysis of variance, we know that the cotton percentage affects the tensile strength at a p-value of 9×10⁻⁶. However, we can see that the results at 15 and 35 percent are quite similar.
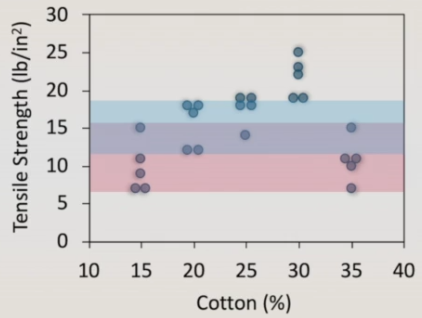
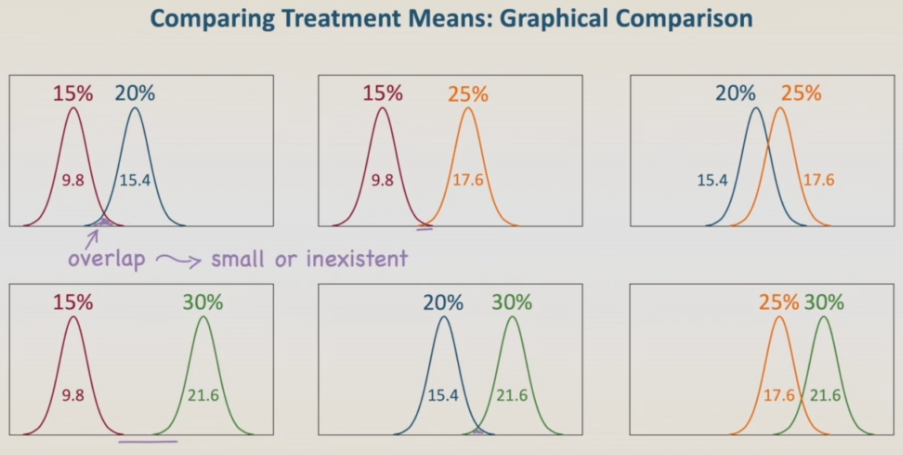 Also, there is some overlap between the results at 15 and 20 percent and there is a large overlap between the results at 20 and 25 percent. Thus, the question that arises is “Which results are different, and which ones are similar?”. First, we will compare the means graphically. The graph on the left shows the results between 15 and 30 percent as a t-distribution of the treatment results. To visualize them better, we have them expanded in pairs. Now, what are we looking for? Overlaps. If the overlap between two distribution curves is small or nonexistent, We see the results or averages are different, as 15 and 20%, 15 and 25%, 15 and 30%, and 20 and 30%. On the other hand, if there is a large overlap between two curves, we say the results are similar. The average result, that 20% does not differ from the one that 25% and the same for 25 and 30%. The question now is: how large must be the overlap for considering that the results are similar? For 20 and 25% the overlap is large, but for 25 and 30 is not that large. the overlap is large, but for 25 and 30 is not that large. How large is the limit overlap?
08 Comparing Treatment Means