Case #1 [1] #
The solvent and the soil matrix blank were extracted by QuEChERS. Then, calibration curves were prepared spiking both extracts (in triplicate), independently, with different concentrations of pesticides. The pesticide matrix effect (ME) was determined using the statistical comparison between the average solvent curves slope and the average slope of the blank soil matrix extract.
From the results (Table below), all the pesticides had ANOVA P-values < 0.05, except for simazine; point out the influence of the matrix soil in 87.5% of the analyzed pesticides. The extent of the matrix effect was also calculated. From all of the pesticides with matrix effect, 75% presented negative matrix effect influence.
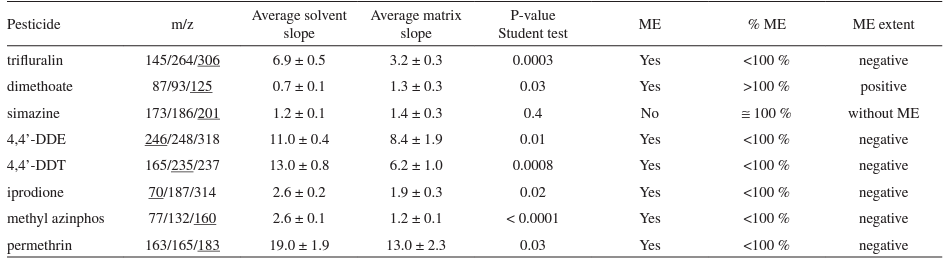
Average slopes of solvent and matrix were calculated from three independent curves, respectively.
Reference #
[1] Ana María Domínguez et al, Evaluation of a buffered solid phase dispersion procedure adapted for pesticide analyses in the soil matrix, Quim. Nova, Vol. 38, No. 7, 884-890, 2015