This is the narrative.
Narrative
Well, thank you for that introduction. And I’d like to thank MSACL for the opportunity to speak to you today about troubleshooting. I owe most of what I know about troubleshooting to Larry McAndrew, who works for AB Sciex. And so I’m very grateful to him. Anything I get right today is really, to his credit, anything I get wrong is certainly only coming from me. I’d also like to thank Judy Chang, Camilla Otten, Kathy Chen at Kaiser Regional Laboratories, my former colleagues, I learned so much from them. And also my current colleagues at UC San Diego, our director, Rob Fitzgerald, I’ve learned a tremendous amount here as well. And in particular, my colleagues, Heather Hochrein, Josh Akin, and Krista Pratico, who have taken time out from their busy day, to document a lot of the cases that I’ll be talking about today, so that I can show them to you.
So I will be talking today first for about 15 minutes on what I’ve called troubleshooting tools. And then spending most of the time on cases, I do have some slides on what I’ve called the strategy or the groundwork for infrastructure that I think is necessary in order to do good troubleshooting. But mostly, those are lists of items. And I don’t really feel that you need me to go through those. I’d rather spend the time on the cases. So they’re available in the appendix section of your handout, the PDF that you should have gotten from Chris, earlier today.
So what do I mean by troubleshooting tools? I’ll be talking today with a lot of analogies as to diagnosis for a patient because I think, first of all, we all work in the clinical lab. And so that’s language that’s familiar to us. And also, I think there’s some similarities about the process.
 So what I’m calling troubleshooting tools are chromatographic images, pressure traces, system suitability test results, if you’re not familiar with that, I’ll talk about it in more detail shortly. Annotation on your maintenance calendar, what I’ve called the acquisition data file records. Again, I’ll elaborate on that. And finally, the concept of divide and conquer, how do you take this really complex system and make it a little simpler, so you can find what’s wrong. So one of the things that a clinician is going to use to diagnose what’s wrong with you is imaging. And here I’m showing you a CT scan and X ray and ultrasound. And I would say that the analogy for us are chromatographic images, I think of chromatographic images as peak review, which to me is how we look at data quantitatively on a daily basis, versus extracted ion chromatograms. And that’s typically done with an overlay. I’ll show you what I mean by that shortly. So with peak review, classically, what we’re doing is looking at a single analyte with its internal standard, often it would be three MRM traces: a quantifier, qualified, or IS. The data is hopefully integrated correctly. And it’s presented to us with a data analysis method that we’ve configured for the assay of interest.
So this is one example from one vendor software. And you can see that there’s a lot of annotation there. Because once again, we built a data analysis method specifically for this assay.
This is just a different vendor, and a different assay. Here, the internal standard is presented to the right instead of underneath, but it all achieves the same purpose.
So the limitation of peak review is that you’re really looking at an analyte and isolation that’s useful when you’re concerned about quantitation. But when you’re working with troubleshooting, I feel like there’s a lot of advantages to using what’s called an XIC extracted ion chromatogram, or TIC total ion chromatogram overlay. if you’re used to using this may seem kind of silly that I’m putting this emphasis on it. But what I found is for people who use the peak review option on a daily basis, they may often miss that an XIC overlay can give you some information that you don’t see the peak review. First of all, the data is unprocessed, typically, it’s not integrated. Although you can integrate it, there’s no assignment of the MRM to an analyte or IS. it’s very easy to see multi-analyte, after all, that’s the strength of using LC-MS/MS. That’s pretty much a qualitative rather than a quantitative view. And it has a lot of advantages for comparing the signal for samples within a run or between runs.
So here’s an example of an extracted ion chromatogram overlay for a 10 component benzodiazepine method, you can see that there’s two peaks there because one of them is the TIC for the analyte. And the other one is the TIC for the internal standard.
So I think the advantage of using an XIC overlays is that it’s much easier to see a relative change and abundance between analytes within run and as I said, between run, although that does need the correct settings and we’ll talk about that was one of our cases. Again, relative changes in retention time and an early versus like peak shapes for example, you can get that when you’re looking at peak preview. But sometimes what may seem confusing and peak review will just leap out for you and be obvious when you look at an XIC overlay. So if not used to using it, I encourage you to learn how to do it.
So the next thing I troubleshooting tool I’m talking about, I’d make the analogy to it’s the assessment of cardiovascular function. So related to pressure, I’m showing you a blood pressure monitor here and an EKG. And of course, what I’m referring to is LC pump and pressure traces. So this top pressure trace is the type of short term noise that you see when you have air and the pump head when you have the tube pump A & B type of system. Or if you have a sticky check valve, because one side of puppet is not delivering the normal flow, once you’ve seen this, you’ll never forget it, it’s very characteristic.
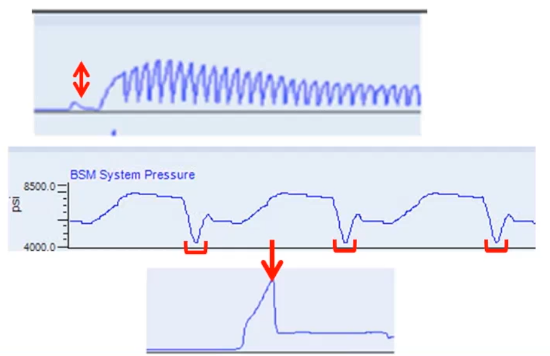 This next trace is just a normal pressure trace, and you can see that the pressure is varying very reproducibly. From injection to injection, this is a gradient analysis, the red brackets are just showing you that the lowest pressure is at the top of the gradient when we have 95% methanol or 95% of acetonitrile washing through the system until we get the lowest pressure. This bottom trace is an example of where we had a leaking peak fitting, we tightened it to try to deal with the leak. And what happened is what often happens in this situation, which is when the pressure tolerance was exceeded, suddenly the peak fitting let loose, we had big leak, and the pressure dropped, what we should have done, of course was changed the fitting rather than just try to tighten it.
So the next analogy I’ve made here is to chart review. We’re seeing old style here manual annotation, this would mostly be electronic these days. And then on the right hand side of the screen results for laboratory tests over time. So the change in cardiac markers after an MI in the upper right hand corner and in the lower left hand corner, looking at the log linear relationship between TSH and Free T4.
And I think that where I would say this is related to is, first of all the results for our system suitability test. If you’re not familiar with that, it’s an instrument check that you do on a daily basis with an unextracted standard.
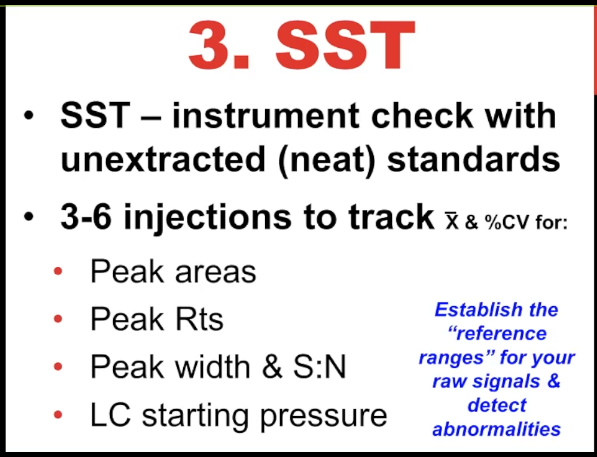 Some people would call that a neat standard, essentially, it’s analyzed in solvent with no matrix, typically, you’re going to have a few discard injections. And then you’d look at the mean, let’s say the last three injections and the percent CV to see what’s happening with
 peak areas, peak retention times, even peak widths and signal to noise I think is useful. And of course, what you’re LC starting pressure is at a very reproducible time, every day that you run it. So you’d establish a reference range. Same thing, it’s for laboratory tests, we’d call it thresholds perhaps in the laboratory for your raw signal during your validation. And then in production, you’re going to run this on a daily basis to see how your instrument is working.
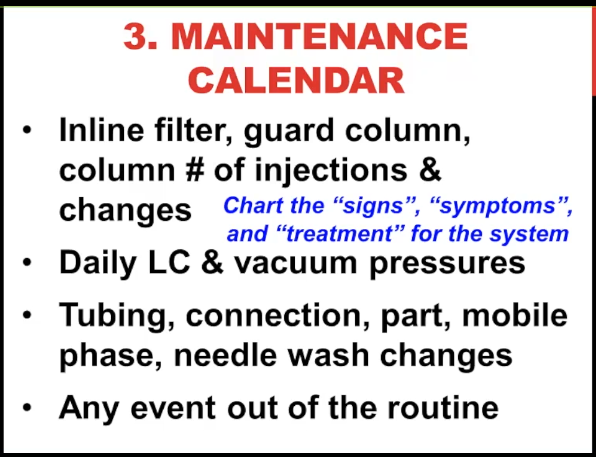 I would also say that the annotations that you make on your maintenance calendar are like charting patients symptoms, or treatment.
So to me, you need to record the number of injections on your inline filter if you use it your current column and guard column. And of course, when they're changed, the daily LC and vacuum pressures can be helpful. Whenever you change anything tubing, connection, part, the mobile phase, the needle wash that needs to be noted. And finally any event out of the routine, because sometimes those are the most informative.
I would also say that the annotations that you make on your maintenance calendar are like charting patients symptoms, or treatment.
So to me, you need to record the number of injections on your inline filter if you use it your current column and guard column. And of course, when they're changed, the daily LC and vacuum pressures can be helpful. Whenever you change anything tubing, connection, part, the mobile phase, the needle wash that needs to be noted. And finally any event out of the routine, because sometimes those are the most informative.
So my first polling question is does your laboratory run a system suitability test each day that you report patient results. So I’ve just showed you at the bottom or reminder of where you can find the feedback, it’s on the participant window, the lower right hand corner, pull up that drop down window, I’m going to check feedback result. So this is nice, we’ve got looks like about two to one that people are running a system suitability test. If you’re not doing it, I would recommend that you think about adding it because it can save you a lot of trouble. If you don’t do a system suitability test and then you launch your batch and it runs overnight and everything’s wrong with it, then you’ve just got to repeat it. Whereas with the system suitability tests, you would know that early on, and potentially you can do a fish. So it looks like we have a total of 51 responses 30 say they if they run it and the other 21 maybe need to think about running a system suitability. Chris, you want to go ahead and clear that feedback for me. Yep, all cleared. Great. Thank you.
Okay. Oops, that was just zooming in to show you how to hit the feedback.
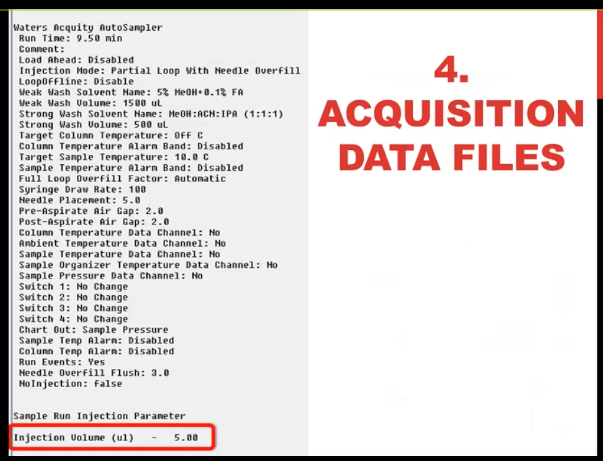 So this is what I called the acquisition data file parameters. For all mass spec software doesn’t matter what vendor you have. There is somewhere in electronic record of all the parameters it’s pages and pages hundreds of pieces of information that tell you how that data file was acquired LLC information mass spec information. You may not need to consult it very often. And you may say, Well, I don’t never need to consult it because I don’t have any problems with my metadata. All I can tell you is, if that’s true, that you know for sure the parameters that you use to inject every sample, you’re the first lab that I’ve ever heard of like that. Certainly, I’ve done it all the time that I thought I, you’d say I injected with one volume, and it actually was another volume, that you can see some of the information in the sample table. But the truth is in the acquisition data file, so you need to know how to access that I’m showing you here, five microliters were injected.
 [10:41]So finally on our final analogy I'm going to make here is to what you'll often see, if you're looking through a chart, which is the physicians organ systems summary.
After they look to the patient and write their notes, they'll say something about cardiovascular function, neurological function, what was happening with your liver and your kidneys. And in this day and age, unless you associate an ICD 10 code with that, basically, it didn't happen, you're certainly not going to get reimbursed. We are lucky that with LCMS, at least we don't have to write down an ICD 10 code for everything that we look at.
[10:41]So finally on our final analogy I'm going to make here is to what you'll often see, if you're looking through a chart, which is the physicians organ systems summary.
After they look to the patient and write their notes, they'll say something about cardiovascular function, neurological function, what was happening with your liver and your kidneys. And in this day and age, unless you associate an ICD 10 code with that, basically, it didn't happen, you're certainly not going to get reimbursed. We are lucky that with LCMS, at least we don't have to write down an ICD 10 code for everything that we look at.
The workflow of system breakdown:
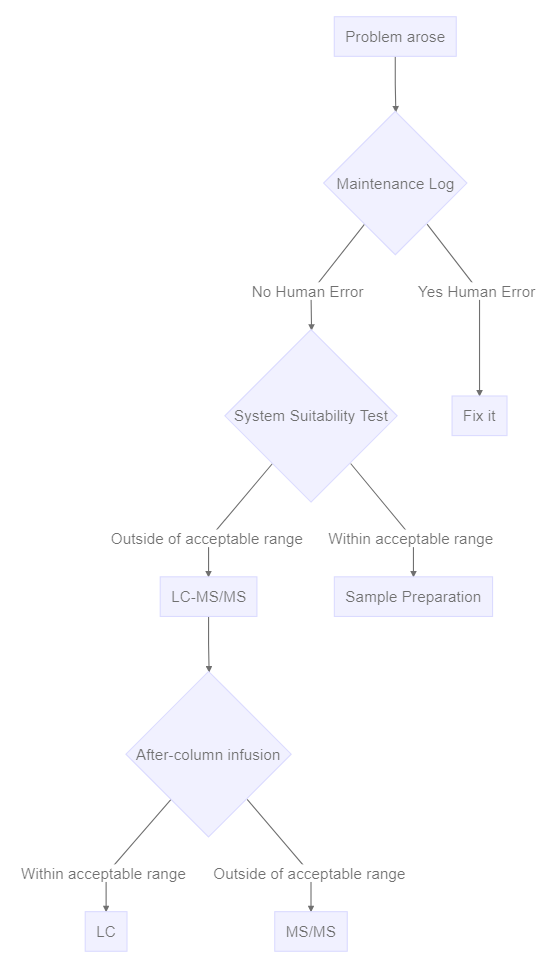
But I think this is kind of like our divide and conquer approach to LCMS troubleshooting. The first thing that everybody quotes this divide and conquer is a system suitability test. And this allows you to distinguish if you have a sample prep problem versus an instrument problem, because of course, it bypasses the sample prep step, we’re using an unextracted sample. Or you could use an extracted sample from the previous day. But you’ve established that that sample is already good.
The next most common divide and conquer principle is to distinguish if you do have an instrument problem, is it the LC? or is it the mass spec? And typically, we would do that by infusing a pure standard and solvent after the column. And this is the setup that you would use, you can see that there’s a syringe pump with pure standard that’s teed in, going directly to the mass spec and bypassing the LC. So that way, you can isolate any changes in signal as associated with the mass spec versus the LC. Unfortunately, it’s not quite as simple as that. But certainly the principle is sound. I like to put into this category, the maintenance calendar, because I would call it you can distinguish between silly human error. that is, if someone has touched something, no matter who it is, including myself, I’m always suspicious that they might have made things worse rather than make it better. And so that would be the first thing I would look at. So long as people are documenting reliably, you should be able to see if somebody’s touched it versus somebody hasn’t. And if they haven’t, then I’m more suspicious that it’s instrument degradation.
Once you’ve decided it’s the LC, then there’s an additional step, which is to say which part of the LC. For example, with overpressure, you might disconnect some of the components starting at either the front or the back of the system to isolate where you’re getting the overpressure. And the $64,000 Question there is what is the normal pressure for that segment of UPLC, sometimes that’s not so obvious. And it makes this process a little more difficult, but your service rep is a great person to show you how to do this, because they’re going to have to do it if you don’t if you have an overpressure problem.
Okay, so let’s move on to cases now, we’ll talk first about peak shape problems, then peak height or area problems. And finally, we have one peak retention time case.
Case #1 Peak Broadening #
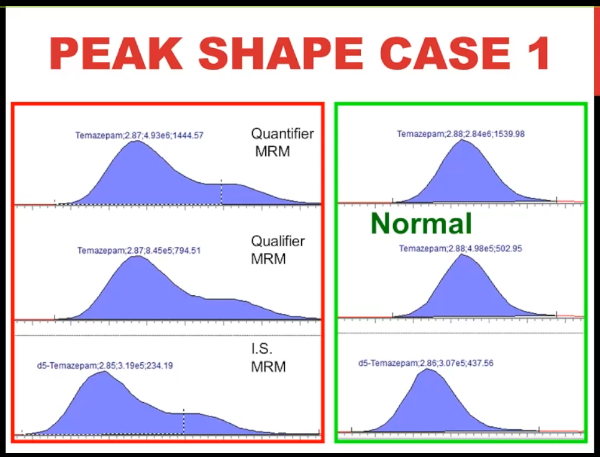 So here's the problem chromatogram. This is using peak review. It's Temazepam, for a benzodiazepine assay, you don't have to know very much about mass spec to know that that's pretty ugly peak on the left, it's split, almost two peaks, isn't it? whereas on the right is what the Temazepam chromatography looks like normally. Okay, so take a flash image of that. And now let's move on to peak shape.
Case #2 Early-Diluting Peak #
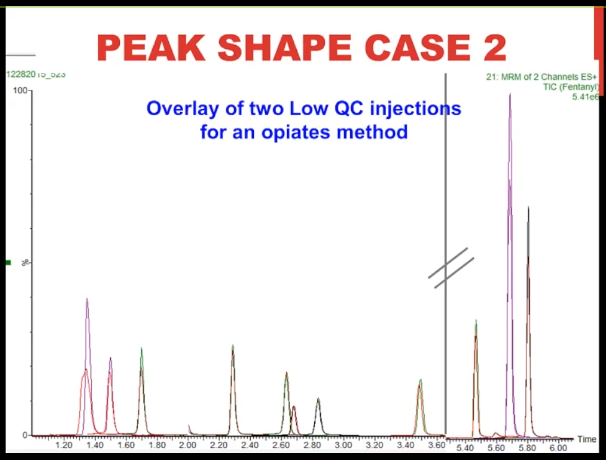 [13:43] So here we're looking at an extracted ion chromatogram of two low QC injections for an opiates method.
And what you can see is that they're pretty perfectly overlaid, aren't they, I just truncated the run, we had some dead space in between the peak at about 3.5 minutes in the weathered about 5.5 minutes, which is wasted space. So that's what the line with the hash marks is representing. So about the only difference we can see is that in some cases, one of the injections had a little bit higher peak height, except for this very first peak. Let's zoom in on that, you can see that the red trace, once again, it's a fatter, it is almost a split peak, isn't it, it's a bizarre shape. And that, in fact, is the problem morphine peak before the fix. And the purple trace sits just behind it is the morphine peak after we made the fix. And what's kind of interesting to me is that the next two peaks, the hydromorphone, and the oxymorphone, are almost exactly the same. They're almost perfectly superimposed a little bit higher abundance with the injection after the fix. So that's case number two.
[13:43] So here we're looking at an extracted ion chromatogram of two low QC injections for an opiates method.
And what you can see is that they're pretty perfectly overlaid, aren't they, I just truncated the run, we had some dead space in between the peak at about 3.5 minutes in the weathered about 5.5 minutes, which is wasted space. So that's what the line with the hash marks is representing. So about the only difference we can see is that in some cases, one of the injections had a little bit higher peak height, except for this very first peak. Let's zoom in on that, you can see that the red trace, once again, it's a fatter, it is almost a split peak, isn't it, it's a bizarre shape. And that, in fact, is the problem morphine peak before the fix. And the purple trace sits just behind it is the morphine peak after we made the fix. And what's kind of interesting to me is that the next two peaks, the hydromorphone, and the oxymorphone, are almost exactly the same. They're almost perfectly superimposed a little bit higher abundance with the injection after the fix. So that's case number two.
And my polling question for you is with this case number two, with the information that you have, would you go ahead and just say this has to be a column or a guard column problem. And so I’m just going to change the guard column right now, without having any additional information. So I’m going to go now to check the feedback. And if you think that you have enough information to make a change and the column or the guard column, please go ahead and answer yes. Otherwise answer no. And it looks like so we have five people say yes, 37 are saying no, 42 are saying no. So I agree with the people are saying no, I think we need some more information. The knee jerk response often is change the column or the guard column, because often that is the problem, but it’s not the only problem. So I’m pleased to see that response. Okay, thanks, Chris, you want to go ahead and clear that feedback for me? Thank you.
Case #3 #
 Okay, here's peak shape case number three.
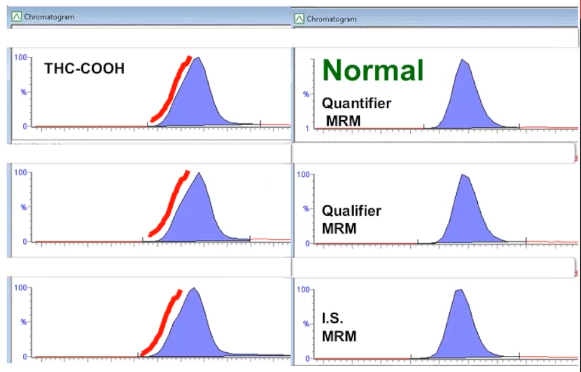
This is from marijuana metabolite. Again, it's in peak review. And the normal presentation, once again, is on the right, the peaks on the left, unless you're used to looking at it, you may think that this is normal, but I think you can see in comparison to the ones on the right, that there's actually a shoulder or the peak is fronting and it's the same for all three MRM. It's not just an interference with one peak.
Okay, here's peak shape case number three.
This is from marijuana metabolite. Again, it's in peak review. And the normal presentation, once again, is on the right, the peaks on the left, unless you're used to looking at it, you may think that this is normal, but I think you can see in comparison to the ones on the right, that there's actually a shoulder or the peak is fronting and it's the same for all three MRM. It's not just an interference with one peak.
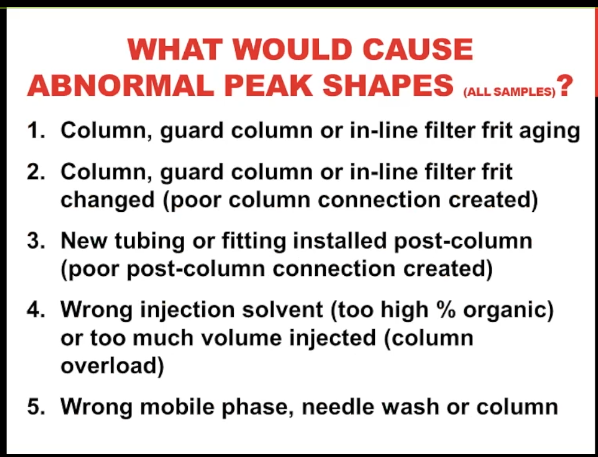 Okay, so what would cause abnormal peaks, we have three examples here. And I want to point out that I’m talking here about a change that suspect just as we saw here, all the MRM is for an analyte, potentially all the samples in one, this is not just an interfering peak was one MRM, which might be say an apparent drug and a patient sample.
Well, first of all, that the column or the guard column, inline filter is aging, we deposit residual matrix on those as we do inject every sample their consumables, and over time, they’re no longer functional, we have to change them. However, there’s also the case that when we’ve just changed the column or the guard column or any other chromatography components, that we could have created a bad connection, and therefore we could have altered peak shape by that process. And we can also do that with a poor post column connection, it doesn’t just have to be the connection at the front of the column. Another thing that’s often under appreciated is that if you use the wrong injection solvent to higher percent organic or too much volume, you can create column overload and distorted peak shapes, or in fact, the wrong mobile phase or need to wash a column all of those will contribute because they all affect the chromatography.
So what is the frit or column aging cause a problem? Well, here I’m showing you a simulation of deposit of residual matrix on the front that the head of the column or the bottom image is a micro photo micrograph of the silica particles at the head of the column. And so what happens is you might get an uneven flow from the fruit deposit or the stationary phase itself is altered into the analytes in the injection volume are not going to partition in and form a narrow band, which is how we should have our chromatography optimized and so the peak shape will be distorted, they’re going to wash on downstream and we’ll get a wider abnormal peak shape.
For poor connection, I have some nice images here.
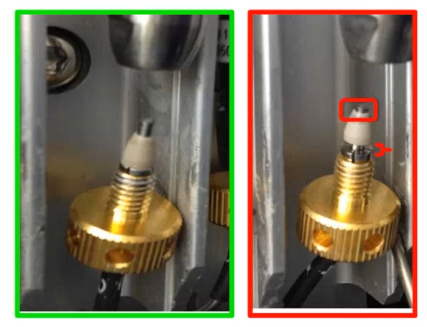 This is showing you with stainless steel tubing and a gold compression screw but at PEEK ferrule, if you’re not familiar with what the ferrule is, it’s that tan conical plastic thing that’s on the tubing. So you’ll see that there’s a gap between the end of the compression screw and the wide base of the ferrule. And that’s the problem because it means that the distance between the narrow end of the ferrule and the end of the tubing is too short. On the left we have that the ferrule is seated down correctly on to the compression screw and so we have the correct distance there.
So what does that translate to? This is a nice image from Agilent websites and it’s even more important, we’re talking about stainless steel ferrule, as well as compression screws, because they vary between vendors.
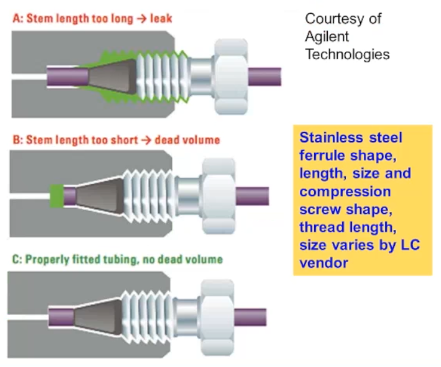 If you’re using a column from one vendor, and you’re using stainless steel ferrules and screws from a different vendor, you may well run into one of these problems. So the top trace is showing you what happens if the distance between the end of the ferrule and the end of the tubing is too long. So here what happens is that’s where the gap, the ferrule is not sitting into what we call
 the meeting port or the head of the column or guard column. And so we get a leak back around the ferrule. in the middle traces the problem that I showed in the previous photo, which is that the distance is too short between the end of the ferrule and end of the tubing. So a gap is created between the end of the tubing and the beginning of the mating part. So we have extra column dead volume and turbulent or chaotic flow and therefore peak broadening. Of course, the bottom trace is when you do everything right and there’s no additional dead volume.
I just had to show this photo because I love it.
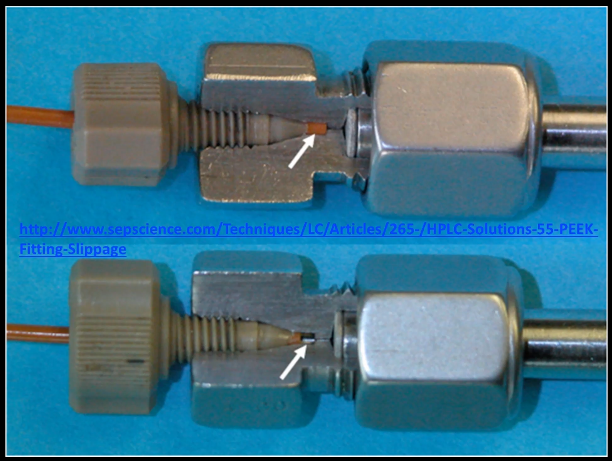 It’s from the SEPScience website, and I think it’s the best representation I’ve seen. It’s a cutaway of the head of a column here using both PEEK tubing and PEEK fitting and you can see that in the top image we have the correct distance of tubing protruding from the ferrule so there’s no dead space, but in the bottom image, the tubing has been pulled back and when have that gap that’s shown with the white arrow. And that’s where you get banned spreading and distortion.
So to make a good LC connection actually requires training, you can’t just put anybody onto the bench and expect them to do it right.
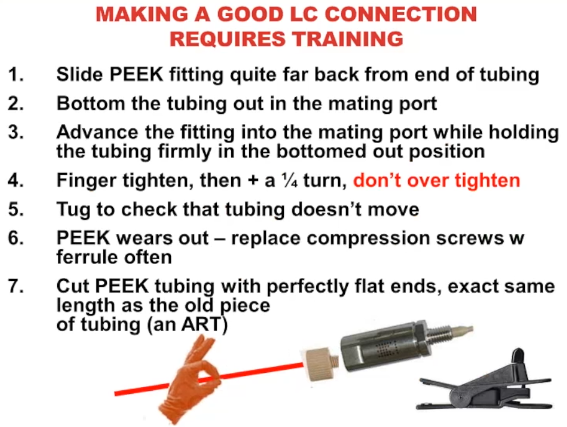 First you need to slide the ferrule back on the tubing. If it’s become clamped onto the tubing, then just pull it off and slide it back again, that usually works for me. Then you want to bottom the tubing out into the mating part of the column or guard column while you hold the felt ferrule back on the tube. Because you want to make sure that it’s the tubing that bottoms out first and not the ferrule, then advance the fitting in to finger tighten it and then a quarter turn don’t over tighten it, that’s easy to do, I’d like to tug it a little bit to make sure that tubing isn’t going to move. And remember that peak does wear out part of the reason that we can use finger tight is because it’s plastic, and it’s a little malleable. So it does where you have to cut pick tubing with perfectly flat end. So once again to avoid extra dead volume and it should be exactly the same length as the old piece. So it’s a bit of an art, learning how to cut pick tubing as well as how to make the fittings, I’m showing you there an image of a pig tubing cutter that I’d like to use.
So my polling question number three is, have you or if there’s a group of you watching, what’s the consensus of the group? Have you ever received any training about the importance of extra column the dead volume, and how to minimize it by making good LC connections and optimizing LC plumbing. So I’m going to pull up our check feedback result. And that’s nice to see up that’s 32 people saying that they have 39, nine people that they haven’t had any. So what are we at almost 50 people saying they know about column dead volume, that’s great about 15 folks who say that they haven’t. So I want to encourage you those for those of you for whom this is new information. There’s a lot available on the web, a lot of great images and animation. Make use of that. Because once you know how to do this, it’s really easy to do it right. But if no one ever told you that it was a problem, there’s no way that you would know about it because it’s completely invisible. Okay, great. Thanks, Chris, could you go ahead and clear the feedback for me? Thank you.
All righty. So I have a column overload. I mentioned that as another source of peak broadening. I’m showing you here a schematic of a typical inner diameter peak tubing connecting with a typical inner diameter LC column. And if we just inject a low appropriate volume, and it’s the correct percent organic, it’s formed a tight down at the head of the column and then migrates down, and we get a nice evenly shaped peak, an appropriate width. However, if we inject too large of a volume, or if the percent organic is too high, then the analyte is going to want to stay more in the mobile phase and in the stationary phase. And we can get it doesn’t form a tight band is the head of the column and we get either fronting or tailing as I’m showing you down there at the bottom in the middle or the right image.
So let’s go through our troubleshooting tools now that we’ve talked about what the etiology of these problems might be.
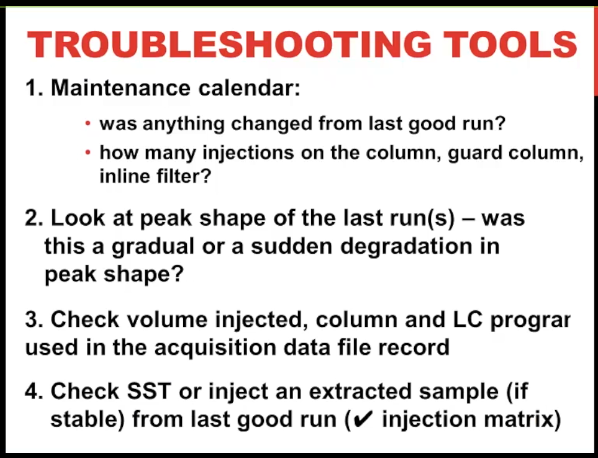 First of all, was anything changed on the system from the last good run? Did somebody intervene? How many injections do we have? Could it be column degradation? For example, I like to look at not only the peak shape of the problem run, but of more recent runs was this a sudden degradation which suggests to me that a person made a mistake? Or is it gradual would suggest just some wear on the system? Finally, I would check the volume ejected and make sure that the column and LC program and acquisition data file record are correct. And if you have a question about injection matrix, for me, the easiest question is just taken extracted sample from your last good run, you know that one worked for you inject that in, it’s fine, then you have to be suspicious that the problem is with the sample from today’s run.
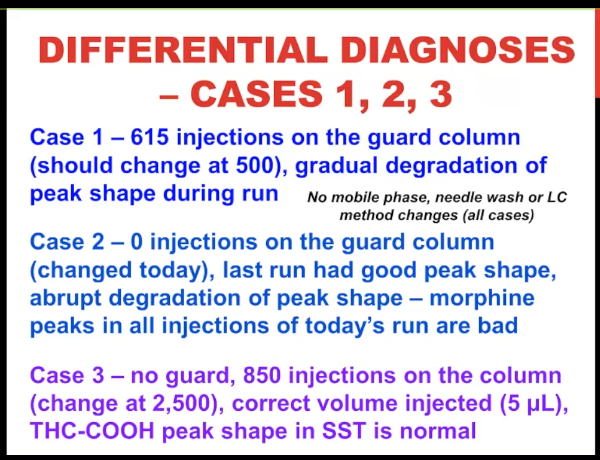
So let’s apply these to our cases, one, two, and three, there was no problems with mobile phase or needle wash or any method changes.
Case #1 #
For case one, we had 615 injections on the guard column And it should have been changed at 500 injections. And when you look at the run, there was a gradual degradation of peak shape. So I would say that that’s a pretty good example of aging chromatographic consumables and the guard column just needed to be changed.
Case #2 #
For case number two, there was zero injections on the guard column, because got changed that morning. The last one had good peak shape. And there was a sudden loss of degradation of peak shape. Starting with this run, and the morphine peaks in the entire batch were bad. So I would say that’s a good example that some type of error was created in the column connection when the new guard column was put on.
Case #3 #
And for case number three, we don’t use a guard column. There were 850 injections and we normally change it at 2500. So it doesn’t really look like column degradation. The right volume was injected, and the system suitability tests like normal for this kind of makes you suspicious of the sample itself.
Case #1 #
So here’s case number one, and it was indeed an aged guard column. Put on a new one injected the same vial and the peaks went back to normal. That’s a pretty slim For one.
Case #2 #
case number two was a bad LC connection. This is where only the morphine peak was really distorted. And although we couldn’t really see that a gap had been created, sometimes that’s the problem, when you take it off, we could see that the ferrule looked worn, tend to be a little bit hard to see. But what happens is the tip of the ferrule narrows, the walls get narrower, and it flares a little bit. And you can see that there’s that dark ring, that’s just indicating that it’s been in contact with the stainless steel. But my colleague did replace the PEEK ferrule. And in fact, we got the good morphine peak, I think something that’s important to take away from this case is that after fixing the connection to peak height almost doubled. So even if you only had a subtle distortion in peak shape, you might get a much higher signal when you have good plumbing and good, good connections. So that’s important to remember.
Case #3 #
And finally, case number three was the wrong injection matrix. So this THC method, normally our injection matrix is 70% of acetonitrile.
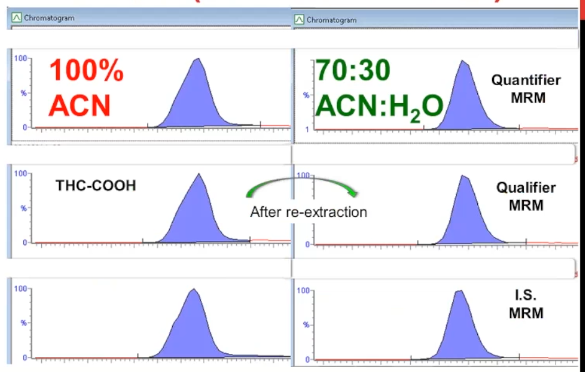 And this sample was this batch rather, was reconstituted with 100% acetonitrile. And so it caused that subtle shouldering or fronting of the peaks. Unfortunately, in this case, the whole batch had to be re extracted. But when it did, we had normal picture.
So I just want to summarize for those three cases, that they all had a different cause. But by applying a similar workup to say, what was the problem, we’re able to discover it pretty easily. So my next polling question for you is, do you know what the rules are, if you want to call them rules for the correct composition of injection matrix, that is the percent of solvent and water in order to yield good chromatography with either an isocratic or a gradient separation, because they’re slightly different rules. So let’s go ahead and look at feedback. And it looks like maybe we almost have a 50-50 distribution, maybe a few more people who say they’re not familiar with it. That actually is not surprising to me. I think this is one of the most under understood, if you like, principles about chromatography. And so what I’ve included in the interest of time, I’m just going to take it for granted that we have more people It looks like who aren’t familiar with it. So Chris, could you clear that for me. And I kind of anticipated this. So in the appendix, I have a slide that gives you a version of those rules, if doesn’t make sense to you feel free to email me and I’ll be happy to elaborate.
Low S:N Cases #
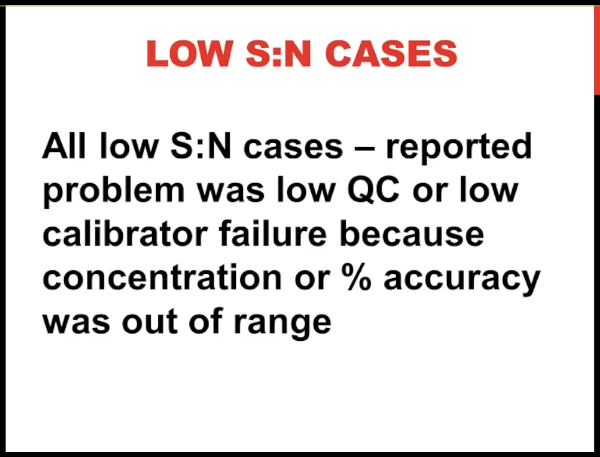 So let's move on to our next set of cases, which is low signal to noise. And I want to point out for all of these cases, the problem was not reported that there was the peaks were too small, what the problem reported was that either the low QC failed, or the low calibrator failed, because the percent accuracy that is the bad calculation against the calibration curve without a range. And this is often the case, because we look all the time numbers not so much at peak areas. And the peak areas when we do look at them are all normalized. So sometimes it can be difficult to detect a decrease in signal.
Case #1 #
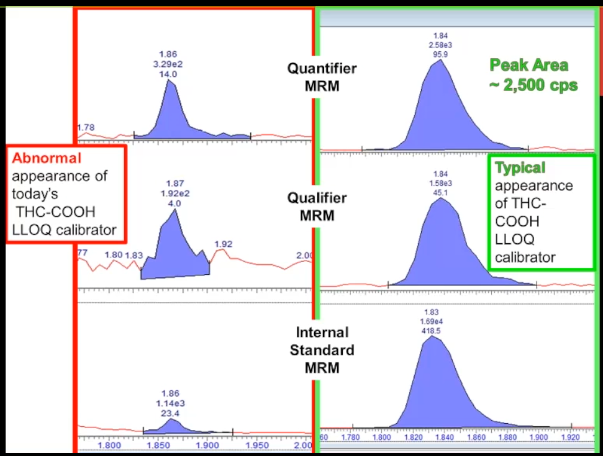 So this is an abnormal appearance for once again, the marijuana metabolites, the lower limit of quantitation, the LLOQ, calibrator. It doesn't look that great does it. The baseline kind of looks too high. But you might not necessarily know how that compares with normal unless I show you this chromatogram on the right, this is peak review. And you can see that there is a very large difference between them. So normally, the quantifier peak is about between 2000 -3000 counts per second peak area. And in the problem chromatogram it's only 330. So we're seeing almost a 90% decrease, that we should be able to figure this out. This isn't a subtle problem. That's case number one.
[28:52]
Case #2 #
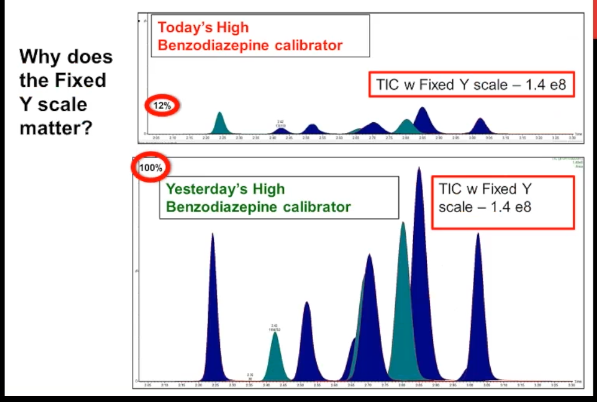 Here's case number two, this is a multiple analyte method much more typical for a modern LCMS method. It's our benzodiazepine high calibrator. And just looking at it, it doesn't look too problematic, does it the peak shape seems normal. And when I show you yesterday's high calibrator, you can see that the retention times are the same. So the only way that you might know something is wrong with this is if you do an overlay or you link the Y axes on both of them, or you do what I've called here a fixed Y scale, then you can see that the problem today, the highest peak is only about 12% of the typical performance, which is represented by yesterday's calibrator. So once again, we have almost a 90% decrease in signal, but with normal chromatography, normal retention time.
Case #3 #
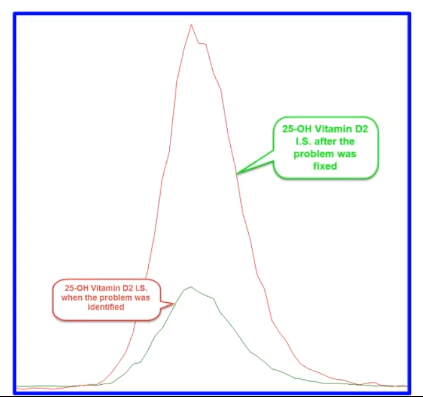 And finally, here's our case number three. This is a lot simpler to look at. The bottom green trace is the 25-hydroxy vitamin D2 internal standard when we identify the problem, and then the red trace which you can see is several fold higher is the trace of after we fix the problem.
So my polling question number five is with no additional information, can we conclude that these three low signal to noise cases are all mass spec related because the chromatography is normal? Okay, I’m gonna pull up the feedback. And the reason that I say this is that when you talk with people who do tech support for LCMS vendors, all too often, this is the call that they get that somebody calls up and says, I don’t have enough signal. I’ve lost sensitivity, it must be the mass spec. So I’m delighted to see and I’m sure the people from Agilent and AB Sciex, and Thermo, and would also be happy to see that most of you think, no, you don’t have enough information to conclude that, and I would completely agree with you. Hopefully, those of you who believe otherwise, will change their views with time after we go through the rest of these slides.
So these cases are more complicated than peak shape, how would we proceed? what I like to do is to first of all characterize the problem, we’ve done that normal chromatography but low signal to noise, and then go through the system and the method to stay, what do I think would explain that.
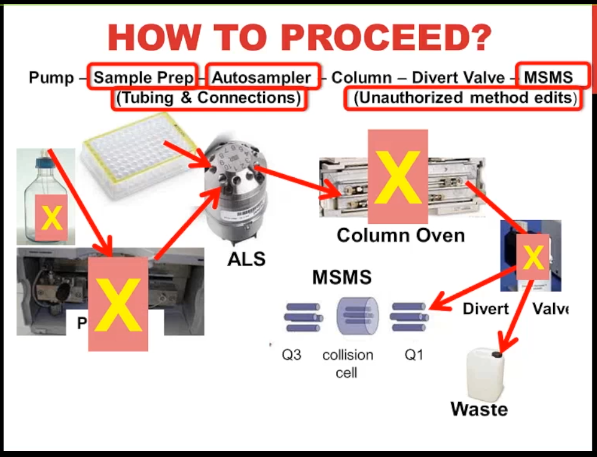 So we start out with a mobile phase, that goes into a pump, that’s then pumped through to the auto sampler, we have the sample represented by this 96 Well plate that’s picked up by the needle, and it moves through the injection valve that I’m showing there, then the flow goes through the column, hopefully to a divert valve, if you’re not using a divert value, you should seriously consider using it, most of the time our flow goes to waste because it’s not informative. And we don’t want to put that into the mess spec and get it contaminated. And then when our peaks are eluding with that flow going to the mass spec. So my view is that if we have normal chromatography, I’m feeling pretty comfortable with ruling out the pump and a column as a problem. Now in a second pass, we might have to reevaluate that, I’m also going to rule out the mobile phase. Although I do want to point out that you have to remember that the mobile phase as well as being a separation reagent for the LC is also an ionization reagent for the mass spec. So potentially, that could be the source of the problem. I’m also going to rule out at this stage the divert valve because in my experience, typically divert valve problems are all or nothing, either, you get like an overpressure, because of plugs just after the different valve, where you have no peaks at all, because somebody’s made an error in programming it and all your peaks are going to waste. So what does that leave us with? Well, it could be sample prep, auto sampler, the mass spec, we can’t forget tubing and connections, we could have a leak, or I always like to throw in there using the wrong method or unauthorized method edits.
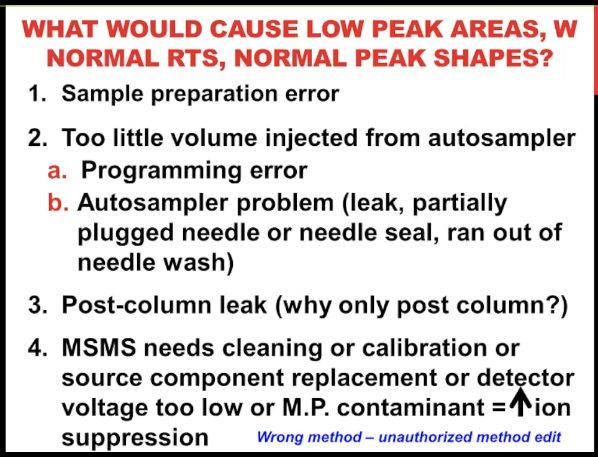 So if we look at that in a list format, to me with sample preparation, I can see very easily how somebody could make an error in which the entire batch would only have 50%, or 10% of the normal amount of analyze. We also could have too little volume being injected from the auto sampler, again, because somebody say programmed one microliter to inject instead of 10. Or it could be that there's actually a problem with the instrument a leak or a plug, or I've seen this when you run out of needle wash, depending on your instrument. We could have a post column leak, and I'll talk in a minute why I'm specifying that it has to be post column in order to fit with this scenario, or could be a problem with the Mass Spec. And there's a range of what those could be. And we'll talk about those in detail in a minute. And as I've said, Never forget, it could be that we use the wrong parameters to acquire this.
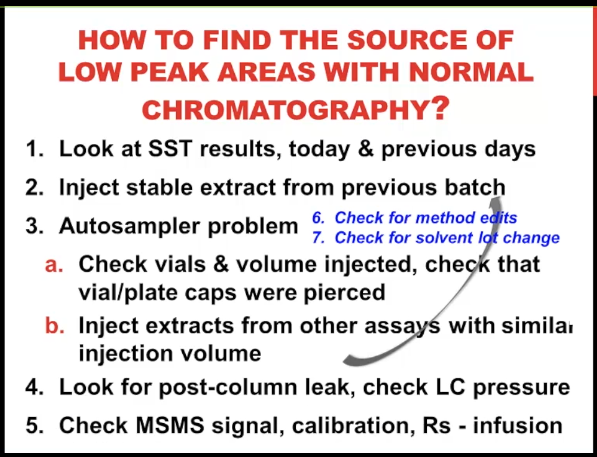 So how do we distinguish between all of those things? Well, first, of course, look at the system suitability test. That’s always worthwhile, I would say not just today, but also the previous days, sometimes the trends tells you something that the absolute value doesn’t. I’d like to inject a stable extract from a previous batch. Even if I’ve done a system suitability, I feel like sometimes I get more information from that sample. For the auto sampler problem, I recommend just pulling the tray out and looking at the vial or the plate, at least see if the cap was pierced, it’s so embarrassing. If you turn out that you’ve been injecting the wrong vail, I can’t tell you how many times I’ve done that, or see if there is any liquid in the well or the vial, that’s also really going to make give you a red face. If somebody comes in and says oh look, here’s the problem. So at least rule that part out. Sometimes you can try injecting an extract from another assay that uses a similar injection volume that may or may not help you to rule out the auto sampler. Of course, if you’ve already done an extract from previous batch, you’ve taken care of that. For the post column leak, the only way I know to find it is to just look for it. And of course, you should check the LC pressure. But remember, most of the pressure comes from the column. So if it’s a leak after the column, you could still have normal pressure. And finally, we’re going to do that divide and conquer step of doing an infusion to check the mass spec mass spec signal isolated from the LC. never forgetting method edits, and hopefully not having to look for solvent lot changes because that can be difficult to do.
Case #1 #
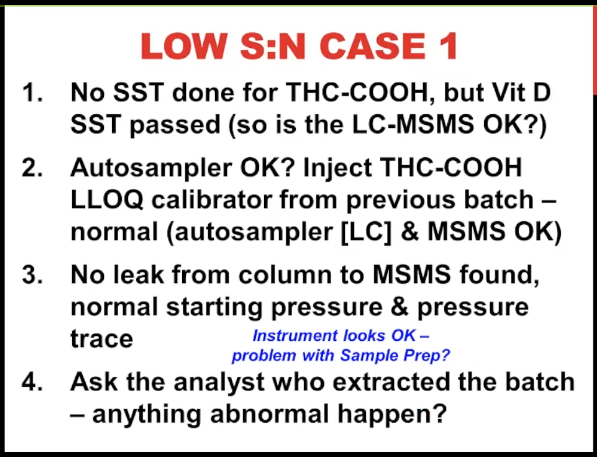 So for case number one, it turns out that we had not done `a system suitability test` for THC on that day. But we did do a vitamin D system suitability test and that passed. So your question might be well, doesn't that rule out the LCMS? For me, I have seen all too many times that you have one analyte that's like `a canary in the coal mine`. And it might fail when other analytes are okay. And let's say the mass spec or the LC system is starting to degrade. And particularly vitamin D, for example is positive mode, EFI ionization for us and THC is a negative mode. So I'm not 100% convinced at this stage that the instrument is alright. So we went ahead and injected a THC LLOQ calibrator from the previous batch, of course, it has to be stable in order to do that. And those peak areas look normal. So to me, that's a very strong rule out that we do not have a problem with the auto sampler, or with the LC or with the mass spec. So that's a very helpful step. Despite that, we still look to see whether there was a leak, and we could not find one and then Stromlo(??) starting pressure and the pressure trace, were all fine. So the instrument looks okay, at this case, we're stage of the game, we're suspicious that sample prep. And so we asked the analysts who extracted the batch see if anything abnormal happen? That's really about the only thing you can do, you may have some `Batch Records` to see whether your extraction reagents, you had a lot changes. But if you're doing manual Sample Prep, it really comes down to what the analysts can tell you.
So my polling question here is, if I tell you that the extraction method for this assay is a solid phase extraction, do you think you can guess what error is most likely? what happened to make us see a 90% decrease in the signal to noise? So we’re starting to get some quick feedback. And it looks like we must have a lot of people who use solid phase extraction, because the majority are saying, yes, they think they know what the problem is. And I think you’re probably right. So I’m gonna go ahead and go through it. And a little more information, just for all of us, as well as for those folks who aren’t familiar with solid phase extraction.
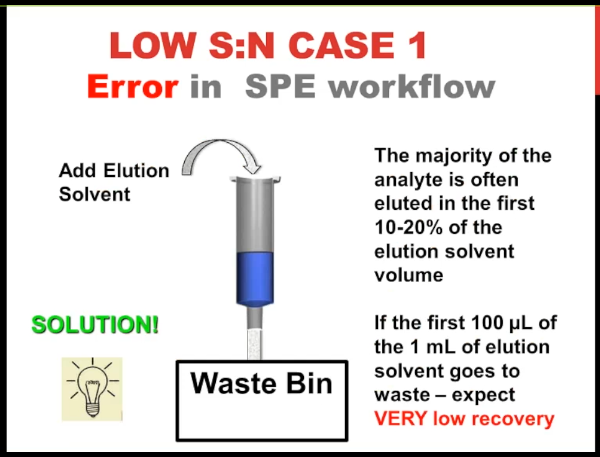 So when everything's working normally with solid phase extraction, you have stationary phase in a syringe ferrule, or in a plate, you apply your liquid sample, the analyte, sticks to the stationary phase, and everything else goes into the waste bin, then you do a few washes to refuse, get rid of matrix and once again, those go into the waste bin, then you dry the stationary phase. And before you go on to the next step, you need to put a collection vessel underneath your column or your plate, it could be a vial or another plate, a collection plate or a tube, then you add your elution solvent. And often it moves to the stationary phase without even even applying vacuum or positive pressure because it's a higher density. So what happened in this case, when there's an error in the workflow is that somebody forgot to take the waste bin away before they added the eluting solvent. And so some or all of it goes into the waste instead of going into the collection vessel. So that was the answer to this problem. And the issue is, although the analyst said, Well, you know, I noticed it right away, and I took the waste bin out, and I put the vial there. And so I was sure that there was no problem. But the issue is that often the vast majority of the analyte comes out in the first 10 or 20% of the elution volume. So even 100 microliters of your one ml elution solvent goes to waste instead of going into your collection. That's all you can expect very low recovering. So that's case number one. So this was a sample crap air and in order to fix it, we had to re-extract the batch.
Case #2 #
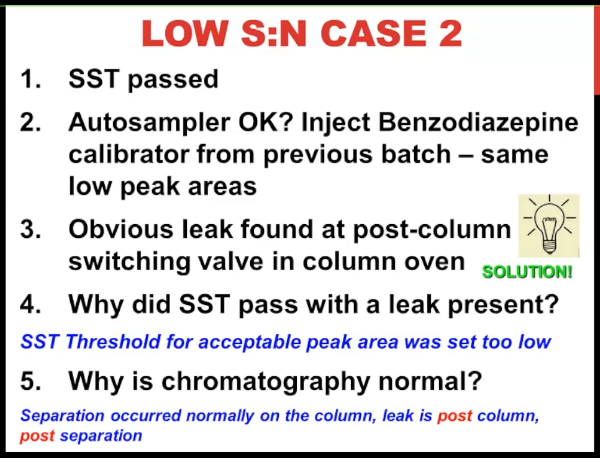 Okay, let's move on to case number two. Once again, the system suitability tests pass. We still have the question is the auto sampler. Okay, so we injected a benzodiazepine calibrator from a previous batch. once again with an established stability for an extracted sample. And we did see despite the system suitability test result, we saw those same low peak areas. So this starts to make us suspicious of the instrument. And without going on to check anything further, we looked for a leak. This is a column oven and where you have to pull the columns out and look behind it at the post column switching valve, and there was a pool in the tray underneath the post column switching. So that was the problem. It didn't take that long to find it. But one of the questions is why did the system suitability test pass if there was a leak present? Well, we had set the threshold too low.
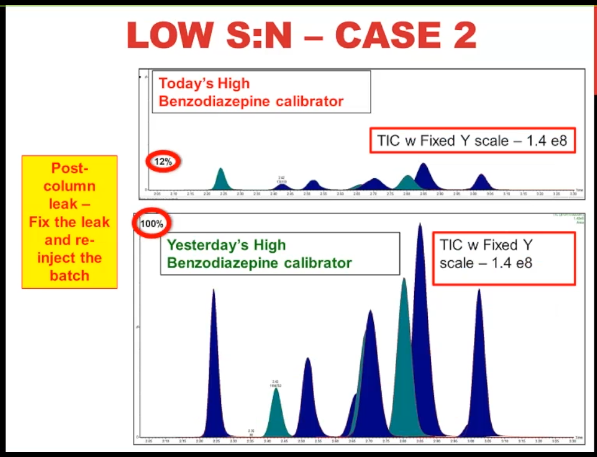 So that's a lesson for you that you have to be careful how you design your system suitability tests, you really want it to be fairly sensitive if it's going to be useful for you. The reason that chromatography was normal is that the leak was post column, the separation had already occurred. And the nature of this leak I guess, was such that 90% of the flow ended up in the tray beneath the valve and 10% of the flow went to the mass spec without any distortion in the peak. So Signal to Noise case number three (should be number two) was a post column leak. Once the leak was fixed, we could reinject the batch.
Case #3 #
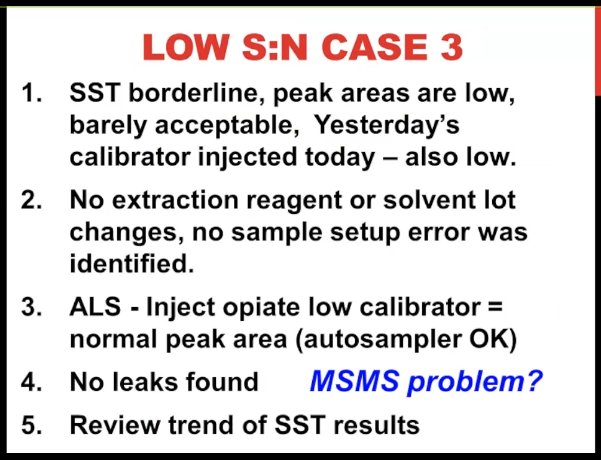 [39:58] Case number three. The system suitability test was borderline 10 pin low peak area barely acceptable. When we reinjected yesterday's calibrator, it was also low. We couldn't identify anything wrong with the extraction. Then(??) had an injected an opiate low calibrator. And that had a normal peak area. So we kind of thought the auto sampler was okay, no leaks. But at this stage of the game, we're thinking it's a mass spec problem. So we wanted to look at the trend of the system suitability test results, as I said, sometimes that's more helpful than the absolute value.
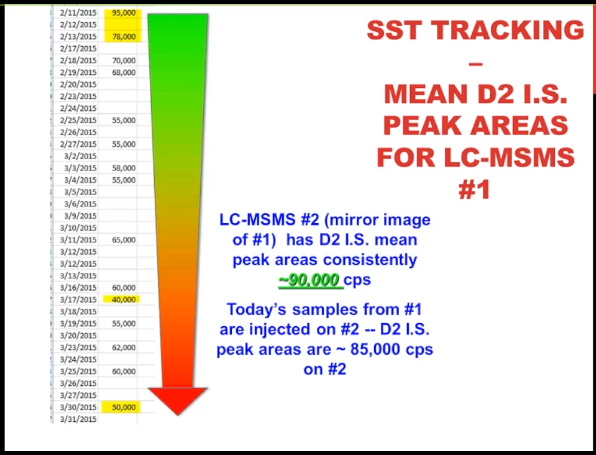 So we record the main vitamin D to internal standard peak area. This is for instrument number one, you’re seeing it running from February 11, down to march 31. You can see back at the beginning of February, where we’re getting peak areas in the 80 to 90,000 range, and then it’s gradually decreasing over time, down to the problem batch today, where we have a peak area of 50,000, almost a 50% drop. And we did have that basket highlighted on March 17, at 40,000. I don’t know how that one got through, but seemingly everything was okay with that batch. However, I think it’s safe to say that we have a degradation over this six weeks or so. signal that to me is consistent with a mass spec problem. And that’s particularly true if I tell you that our other mass spec instrument instrument number two has D2 IS mean peak areas that are around 90,000, about where we started out in February with instrument number one. So we took the samples from one and injected them on two that’s a luxury that we have. And we did see those higher peak areas again suggesting that there’s problem with the Mass Spec of number one.
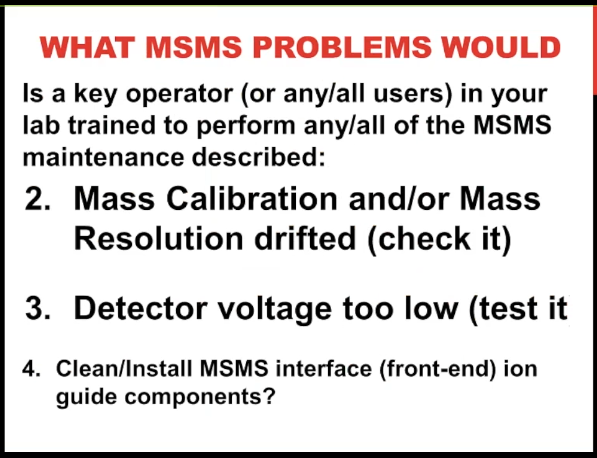 So let’s drill down on that a little bit. What could be wrong with the mass spec? Well, we could have an aged electrospray ionization capillary needed to be replaced, the mass calibration or resolution could have drifted. So we can check that as we can check the detector voltage to see if it’s too low. Or finally, the mass spec Interface Region could be dirty and need to be cleaned.
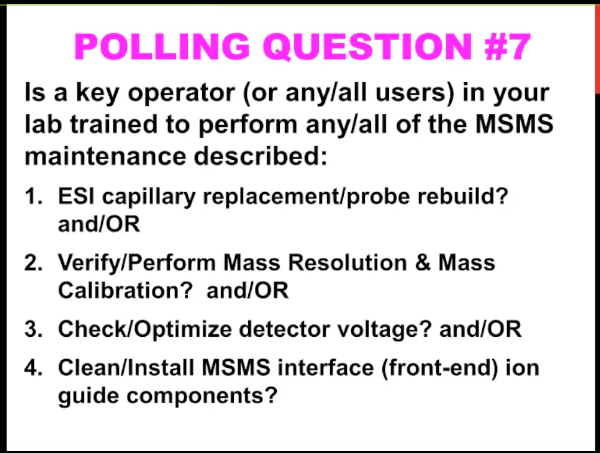 So my polling question number seven for you do you have at your site, even one person, it could be a key operator or maybe everybody is trained on how to perform even one of these mass spec maintenance steps that I’ve described. So ESI capillary replacement? checking math calibration? detector voltage? or finally cleaning the interface? So that’s kind of good news. For me to see, I see that the vast majority of people are saying that at least there’s one person who can do some of it. Because often new users are intimidated about touching the mass spectrometer, and it’s appropriate to make sure that you don’t break anything. But believe me, anybody can, if you’re careful, and you’re following procedures, your service rep can teach you how to do all of these maintenance steps. I’m a collector and I can do them. So I’m sure that you can. Alright, that’s good news to see that. Thanks, Chris.
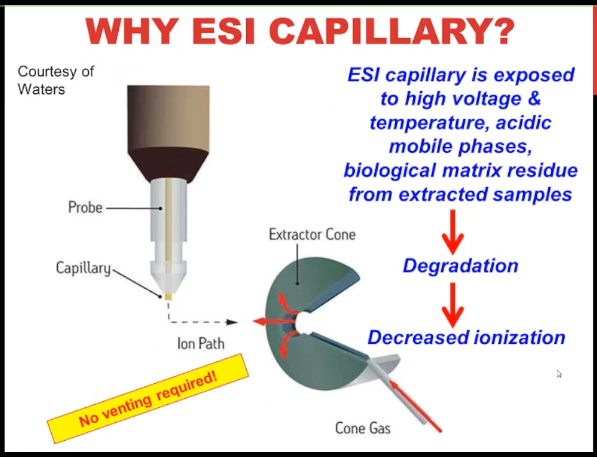 So for the ESI capillary, this is a nice image from the Waters website. Essentially, you need to think of it as a consumable even though it’s a pricey consumable, it’s exposed to a lot of things that could degraded over time, then we’re going to have decreased ionization and decreased signal just needs to be changed. The best thing about it is no venting required.
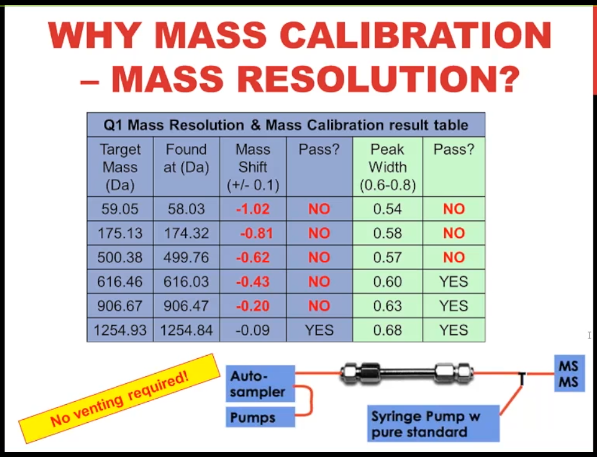 It’s the same thing with math calibration resolution, it doesn’t go bad very often, it’s rare. But if you do, you would do an infusion of the vendor’s calibration solution using that same infusion setup, I’m showing you the schematic down there at the bottom. And if you see something like this here, where either the mass calibration or resolution is out of spec, then that could account for your low signal, and you need to recalibrate redo resolution and calibration. Once again, no venting required. That’s the strength.
So I’m going to ask you quickly before we go on, because we’re running out of time for do you know with quadrupole mass analyzers, if you set the system to have a higher mass resolution, which you have the capability to do that gives you a narrow peak width. Would you expect to have lower signal abundance? If you think that higher resolution means lower signal than previous answer? Yes. If you don’t know, or you think that’s false an answer? No. So it looks like the vast majority of people are familiar with the fact that it’s a trade off like so much in life in mass spec, between resolution and sensitivity. Higher resolution means lower sensitivity. Okay, great. Thanks. We’ll move on. So true.
 Detector voltage once again, this is like any other type of detector, we need to it ages with time and you may need to perform a test to see are you using the lowest potential voltage that you can to get the right signal or you need to increase it. I do want to point out that cranking up the voltage on the detector is not a substitute for solving the problem because you get increase noise as well as signal and so you're not actually getting anywhere by doing that. Once again, the best thing about it is no venting required.
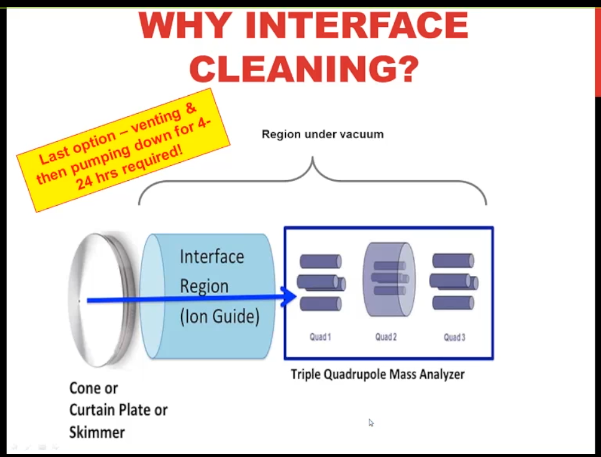
Why do I say that? Well, the final step is that you need to clean the interface region, which I’m showing you in schematic here. And in order to do that, you need to break the vacuum on the instruments invented, change out those parts or clean them and then put the clean parts back in, and then pump it down. The first few steps are quick, it’s the pumping it down, it takes a long time, maybe as much as 24 hours if you have a high end instrument. So What this showing you is that the blue arrow is the ion path, I don’t know if you can see my mouse, this first metal surfaces the cone or curtain plate or skimmer, that’s what your ions in the gas phase encounter first, they move through the orifice. And then they hit the Interface Region. And if you have residual matrix in your samples, which basically all of us do, no matter how much we clean it up, that’s the first place that is going to be deposited. And as it gets deposited on those stainless steel or possibly ceramic surfaces, no surprise, it’s going to change how the applied voltages interact. And so you’re going to lose signal over time.
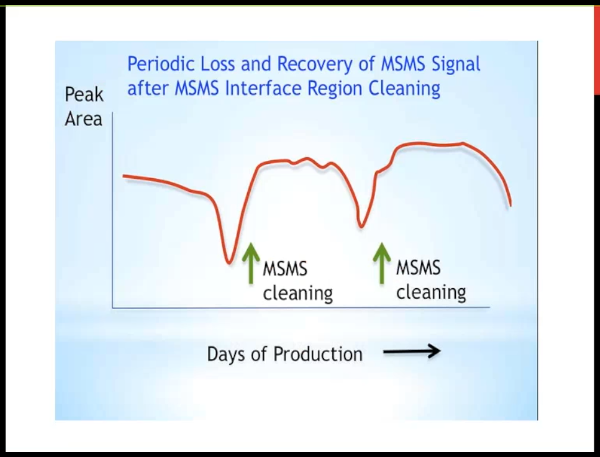 So in my experience, this is not a question of "is this going to happen?" as a question of "when?" We're injecting extracted samples of biological matrix. And so the interface is going to get dirty, we clean it, and we get our signal back. And so the interval in between cleaning is only a matter of how many samples we inject? how well we program the diver valve? and and how much we've cleaned them up? And so the advantage of cleaning up samples more is potentially if you length that interval, you have less downtime on your instrument.
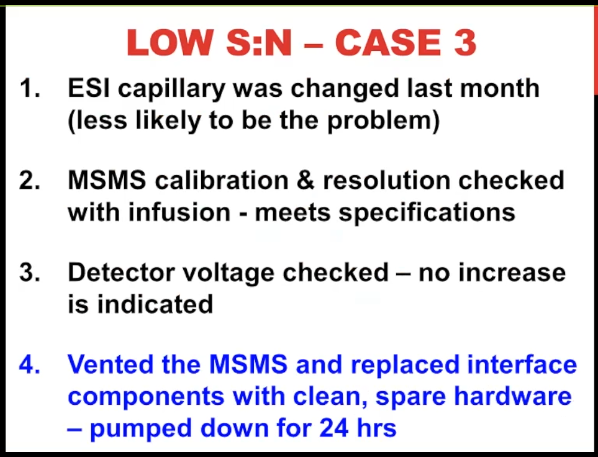 So our low signal to noise. Case number three. the ESI capillary had been changed fairly recently, we didn’t think that was the problem. The resolution, calibration and detector were all fine.
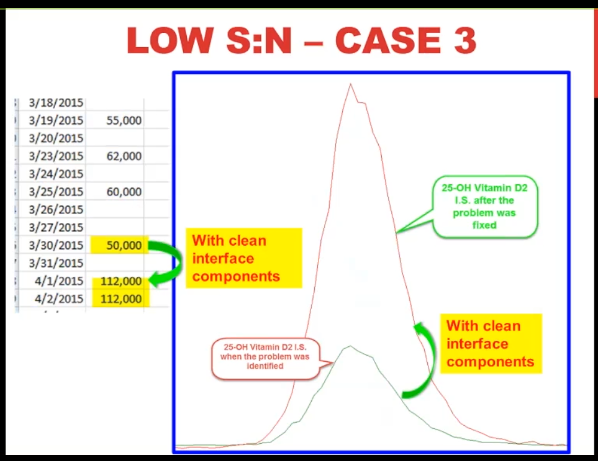 So we thought it was the interface, we’ve entered the mass spec, we have spare clean interface components that we keep on hand. So we were able to put them in and started pumping down right away after 24 hours. But we saw was this almost a doubling and signal with the clean interface components.
And you can see that visually on the right. So that seemed pretty convincing to us that that was the problem.
So we thought it was the interface, we’ve entered the mass spec, we have spare clean interface components that we keep on hand. So we were able to put them in and started pumping down right away after 24 hours. But we saw was this almost a doubling and signal with the clean interface components.
And you can see that visually on the right. So that seemed pretty convincing to us that that was the problem.
Retention time #
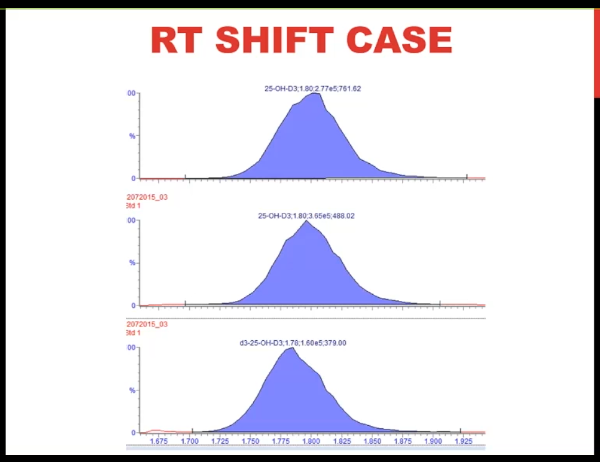
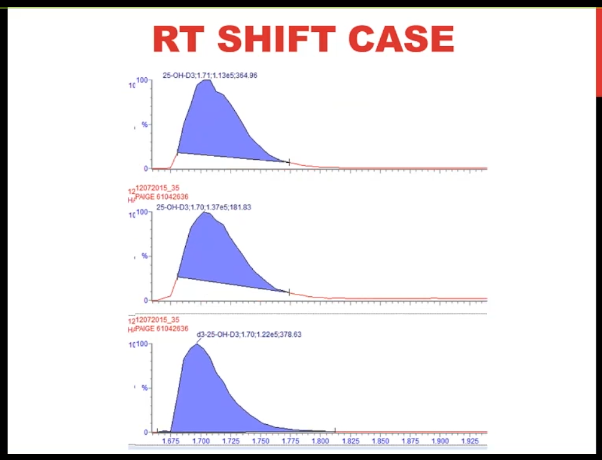 So I want to finish up with this retention time shift case. This is for vitamin D. And what you can see is as we go through subsequent injections in the batch, that the peak appears to be moving to the left. So the retention time is shifting.
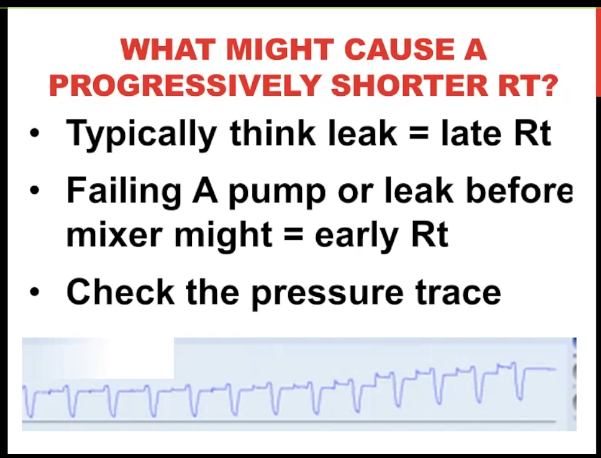 And it's getting progressively shorter. Now often when we think of a leak, we think of a later retention time. But I do want to point out that if you have a failing A pump that is that your mobile phase A is the aqueous phase, if you're doing a reverse phase separation, or if you had a leak in that pump before the mixer, you could potentially have an earlier retention time because let's say you think you're delivering 75% B but in fact, you're delivering 80 or 85% B and pushing the analyte off earlier. I think though that the first thing I'd like to do is check the pressure trace. And that's what I'm showing you here. And what you can see is very reproducible pattern, but the pressure is gradually increasing across the run. And we saw that several times that as the pressure increased, we had shorter retention time.
 So we looked at the history of our pressure. We’ve been running this method for several years with no problems. And then all of a sudden, we’re having several of these retention time shifts per week on both instruments, and sometimes it over pressures and shuts down on the overnight run very irritating.
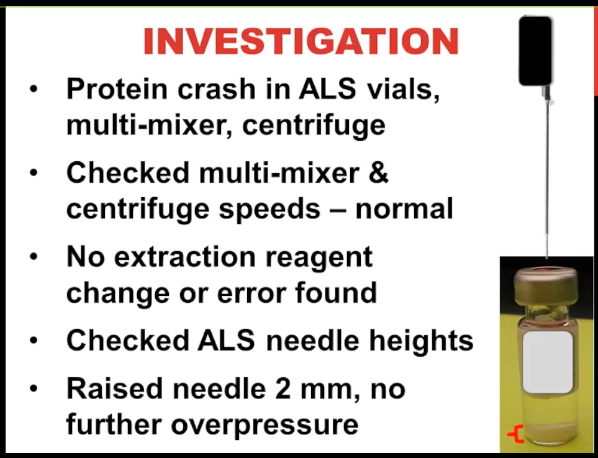
So our question was what changed. This is a protein crash it directly in the auto sampler, while I’m showing you there in the lower right hand corner what the vial looks like. And that’s the precipitation of serum proteins in zinc sulfate where the red bracket is, we put it out in the multi mixer for multiple vials at one time and then centrifuge it. We checked the speeds on both of those thinking maybe there was still protein suspended in the liquid that was being injected, those were okay, we couldn’t find anything wrong with the extraction. And it happened across multiple batches. So we figured it wasn’t one analyst. So then we looked at the needle height for the autosampler. Because we’re thinking I’m showing you the representation of the needle here that maybe what was happening is going down too far into the sample and picking up some of that particulate and injecting it onto the column each time where it was depositing and the increase in the pressure. Well, the needle heights were normal, but nonetheless, we raised the needle by two millimeters, and then we haven’t had any further overpressure problems. So this was one of those cases which frankly, to me happen all too often where we had a solution but We don’t really have an explanation for why it happened.
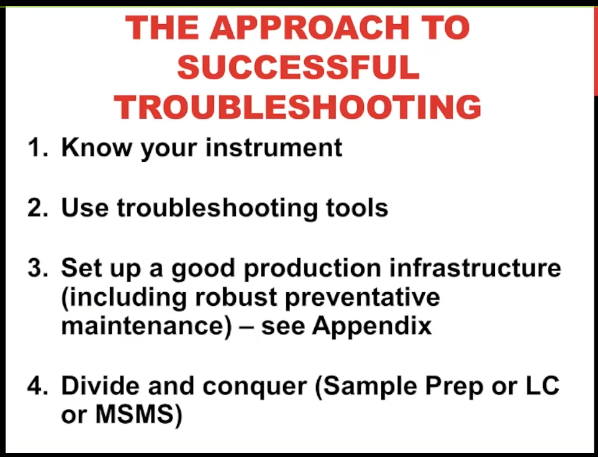 So in my view, the approach to successful troubleshooting is you need to know your instrument. We didn’t talk about that in too much detail. But I have some recommendations for that, in the appendix, use troubleshooting tools, we talked about that, and divide and conquer principle, we covered that, in our cases, the good production infrastructure. Once again, I have some information in the handout. And so I’d like to finish up by just saying, these were a lot of fairly simple cases, my colleagues who are going to follow in the next three weeks, are really talking about some more interesting things having to do with method development or proficiency testing problems. But we wanted to start out with this. If you do these kinds of things every day, then this wasn’t too helpful for you. But if you’re just starting out, it can be a black box. And so we thought we wanted to cover some of these basic things. So for us to know, what would be the best thing to to help you out, it looks like so far, people are saying, yes, they might want to see some more of these basic case presentations. I hate to say this, but I have all too many of them. So no shortage of cases. And we’ll see what we can do to deliver some more of them to you. So I’m going to stop now. And I think that leaves us five minutes for questions. Thank you so much for your attention.
Excellent. That was a great presentation. Thank you, Judy. And I can see that there’s more interest in further webinars on this topic. So we’ll do our best to build them. So we have a couple of questions that have come in.
Q: First of all, does triple flow have an impact on peak shape?
A Wow, that’s a great question. And I wish that I had worked with turbo flows, so that I could tell you about it from my personal experience. I haven’t. So I don’t know enough to say if a normal turbo flow chromatography looks like normal any other chromatography, but my guess would be yes, because that’s the extraction step. And then from what I understand if it is typically you would have an analytical column afterwards for the separation. So I think it is a challenge to make sure that you can focus the peak from Turbo flow onto the analytical column. But my expectation would be if you do that correctly, that you should have normal peak shape.
Just to repeat that question, because some people didn’t hear properly. The question was, does turbo flow have an impact on peak shape?
Q: Another question we have is, do you have a maintenance calendar example for a low volume lab?
A: So that’s a great question. And I apologize, because I said that I was going to put a maintenance calendar example in the handout, I did make some suggestions. But it didn’t, per say include a table. So Chris, would it be a problem? If I provide that to you to send that out to attendees? Calendar example. Okay, I don’t I don’t think, frankly, that there’s that much difference in what you do. It’s just the frequency with which you do it related to low volume, because you just don’t have things wearing out as much. And so I’d be more than happy to provide that to people.
So we can take care of that afterwards. There’s also a question, how can I get a presentation Powerpoint file? We’re not providing this as PowerPoint at this time, but it’s being provided as PDF. And that’s on the registration sites. You can find the file there and also send an email follow up after this to a couple more questions. We have a couple more minutes. So let’s see here.
Q: Do you set up your SST or system suitability test for all compounds, you have multiple compounds in your analysis?
A: That’s a great question. First of all, we what we do is five or six assays. And we have two instruments that are mirror images of them. And so we switch back and forth between the two, the two instruments with all of the assays, and we do not run like we might run three different assays on one instrument and believe me, we do not run three different system suitability tests, because it just takes too much time even though we should. So that answers part of the question. The other question is, is something like the 11 component, opiate method that we have. I was wondering if somebody was going to pick up on this, which is to say with that morphine peak shape problem that we had, why did we pick that up with a system suitability test? Isn’t that the point of it? Well, it turns out that we only monitor one analyte in that system suitability test, and that’s the North fentanyl(??) peak, which looks perfectly normal with that problem. So probably we should be monitoring. As I said, the canary in the coal mine analyte, which was opiate buffin is morphine, because it doesn’t retain very well on a C-18 stationary phase. So I think the problem is if you monitor all your components, you could spend half the day determining whether your system suitability test is good. So you have to find some balance. I would say, you know, trying to pick the thing that’s most sensitive to chromatography changes, and to mass spec changes. Make sure you set your thresholds low enough. and pick the analyte that you think is most dubious. I often hear people saying, oh, I want to pick the most robust analyte because I don’t want it to fail. Well, I feel like you’re just shooting yourself in the foot with that final point. And this system suitability test is to tell you when something is going wrong, you just have to know how to interpret it and to set your thresholds appropriately.
Q: So I think we have one more question that I got kind of interesting, as you said, the mobile phase is an ionization reagent for the MSMS, as well as a separation reason for the LC, is there ever a problem with the mobile phase component causing ion suppression.
A: So I would have said that I’d heard about this theoretically, but never encountered it until the last few years. And I actually have two examples for you. One was a case where the mobile phase was prepared. Normally, it did involve some human interaction, like some pH, ng checking of the buffer. And when the mobile phase was put on to the mass spec, we had a jump up in the baseline from less than 1000 cows to like 20, or 30,000 cows. And so the low abundance peaks like in the lower limit of quantitation calibrator, were just swapped out by that increase in noise. Now, we did not know what caused the contamination in the mobile phase. But we were suspicious because it happened just after putting that mobile phase onto the system. So we swapped it out washed, everything made a new mobile phase, and then everything was fine. At a separate problem more recently, where we ran out of LCMS grade methanol, we used HPLC grade methanol, which believe me I have used and not had problems with, but we saw an immediate decrease in our vitamin D to signal with the HPLC math and I want to say maybe a 30 or 40% signal, which might not be that much with other athletes, but vitamin D, we don’t have a lot of margin. So we had to get we were immediately suspicious. That was the problem, we had to remove it wash everything out extensively. And then when we went back to the higher grade of methanol, everything was fine. So I had in fact have seen the problem of the mat of the mobile phase being essentially an ionization reagent and having you fail having a sale.
Okay, so thank you very much for that. Basically coming in at a time, just wanted to get one of the upcoming webinars are coming the rest of this month, January 12. Next week, we have omiyo pesky with monitoring, monitoring truck compliance and urine. The week after that on Tuesday as well is Alan Rockwood with LC-MSMS. Troubleshooting had a large reference lab. And to close off this group of webinars, we have Dr. William Clark, translating from troubleshooting to quality improvement LC-MS/MS. case histories from an academic medical center. So thank you all just one thing. We’ve got the MSACL 2016. US conference coming up this February. I think most of you know about it. Some registrations open early bird registration tomorrow deadline January 6, poster you want to submit we still have some slots. The final deadline for that to make the printed program is January 20. And also we have the EU conference in 2016. As well, this September, with the deadline for the podium abstracts on May 11. Again, I’d like to thank Judy stone and all of you have attended we had 160 participants, participants today, which was more than we expected for our first webinar. Great students great city interest. And we’ll look forward to seeing you all or most of you next week and the rest of this month. So thank you. Have a great day. Bye
Reference: MSACL. The Basics of LC-MSMS Troubleshooting: Tools, Strategy, Cases