This is the narrative.
My Comments
It seems to me that the speaker took proactive approach to troubleshoot a problem before the problem arose. He overlaid the current one with the reference, and see if there is any deviation.
Summary
The Goal of troubleshooting LC-MS/MS in this training:
- Isolate the specific, most likely cause of a problem
- Reduce downtime
- Reduce cost
- help service engineer to show up with the correct parts to complete your service quickly
General Troubleshooting tips:
- Visual inspection is Key
- Start by “breaking the system down”
- Having a BASELINE for all metrics is critical to proper troubleshooting
- Logbooks to track problems and solutions
- Reference values for instrument readbacks
- System suitability
Organized Transcript #
We are going to go through the visual basics of being an effective troubleshooter. First, we want to be able to isolate the specific most likely cause of a problem to the most specific reason that we can, and then maybe we’ll be able to repair it ourselves.
Raw Transcript #
Throw some hands up and get this thing to be a little interactive today. So you know who you are. So what we’re gonna do here, I want to I want to this material is going to be delivered a little bit differently, I hope it’s going to be very interactive. We’re going to talk about the basics today. So this entire couple of sessions is going to be on troubleshooting and, and how to be an effective troubleshooter with a lot of effect and specific examples. And so what we’re going to do now is we’re going to just go through the, what I’ve called the visual basics of being an effective, effective Troubleshooter. We’re going to use that as some examples. Here we go. Okay, so what do we want to accomplish? First of all, let’s set our center goal somewhere. So what do we want to accomplish generally, in a clinical laboratory setting, as a as an effective troubleshooter. First, we want to be able to isolate the specific most likely cause of a problem, we’re not going to try to become engineers, most of us, what we really want to do is be able to isolate the exact cause of a problem to the most specific reason that we can, and then maybe we’ll be able to repair it ourselves. If it’s something like a column failure or tubing replacement, something like that, maybe we won’t. But either way, the rationale behind troubleshooting is often to reduce downtime. Of course, that also reduces cost. And another way it reduces cost is to help your engineer to show up with the correct parts to complete your service quickly. So if you have to make a call, how many of us have, you know, a two day turnaround or something on the engineer showing up. And then the first day, what they do is they, they troubleshoot the problem. And then at the end of that day, hopefully they can order the parts, maybe the parts take a day to get there, if you have a problem with shipping, sometimes in the US, if they’re shipping parts from overseas, it’s going to take two days to get the parts there. So you’re taking another two days, and then they come in, and then they replace the parts. Okay. So contrast that with the scenario of you are empowered to identify specifically what the problem is, during the two days that you’re waiting for the service engineers show up to show up, the parts are ordered, they show up the same day the service engineer does and the repairs made, right. So at that time, you’re able to save yourself a couple of days, likely a few number of hours of you know time on site, if you don’t have a full service contract, that’s gonna save you a lot of money. And so that’s really the goal, I think of being of why in a clinical laboratory. Or you want to be able to address a troubleshooting scenario and become and build the skills it takes to be a more effective Troubleshooter.
Okay, so, I’ve always tried to frame this conversation in broad generalities. So I think in order to be a an effective troubleshooter, you need to be able to do a couple of things. First, you need to understand how to do a visual inspection. And so we’re going to spend a lot of time today kind of working through what I mean by visual inspection, how do you use visual inspection to identify causes of the most likely cause of a problem. Then you have some very basic tools in your toolbox to start by breaking the system down. And on the next slide, I’m going to just show a very simple scenario where we have a workflow that we use to how to break the system down this particular application that I’m talking about troubleshooting as LC-MS. So the obvious place to break them is that the dash right, so we’re going to talk about the LC, and we’re going to talk about the MS separately, if you can isolate your problem to one of those two things, and then further isolate the problem from there, it’s going to make you much more effective. The worst thing that you can possibly do is walk in and look at this very complex system and say, I have no idea, throw up your hands and walk away, right? Because you just have to think about breaking the system down into more simple parts, and isolating one of those parts, you’re going to be amazed the amount of time that someone on the phone can help you. If you just know actually you’ve already figured out if it’s the LC or if it’s the mass spectrometer, just having that small piece of information is very valuable. And then finally, this is a pet peeve of mine is having a baseline for all metrics is really, really important to have to being a good troubleshooter and what I mean by that is if you don’t have a logbook, to track problem problems and solutions, and even more importantly, you know, what was done on an instrument if you replaced the mobile phase, if you replaced column if you you know, may did a some sort of performed preventative maintenance. If you don’t have that logbook, you’re gonna be you’re gonna it’s just one less tool that you have at your disposal to figure out what might have caused a problem. So logbooks are really key, they don’t need to be complex, or fancy. It’s normally in our lab is just a book, right? We have it’s just exactly what it’s an old school books ending on the instrument. Some of them some of our systems, we’re going to more digitized sort of recording format where we have it along with system suitability data, but in general Oh, doesn’t really matter what you use as long as you use something. The second thing is having reference values for instrument readbacks. So you know how many people haven’t memorized all of the readbacks of their mass spectrometer, right? Everybody knows everything that they you know, so no, nobody does. If you go into these tune pages, there are hundreds, literally of settings and readbacks and your instrument tune page. Similarly, there’s hundreds of settings on your LC, you know, gradients, maybe a little bit less than your LC methods, but there’s too many to to, to record or to memorize, right. So you need to have the best way that I’ve found to have these reference values is when you’re setting the machine up, take screenshots of your tune pages, and record them in a PowerPoint presentation, right, and then have them either inch with your instrument logbook, or in a separate in a separate location as a file, right, just allows you to go and quickly refer to what the current situation of your instrument is, and compare it to the situation of the that your that your reference was, what’s your how it was when the instrument was operating properly. And then the final thing is you need to have a lot of baseline system suitability data. So everybody here do system suitability, maybe it’s called something a little bit different. Okay, so everyone, most people do system suitability testing. When did people establish their system suitability criteria? When does that occur? Most of the time? We’re going to start with little interaction here. When did people establish their system suitability criteria? No. Okay. So the question here is, how do you so you have to start somewhere when you measure system suitability, right. So when Where do you establish that range of system suitability that is good. So you have some range that you think is good or bad? When do you establish that range? established? It just was always, so you run it 10 times.
Before and after each assay, and the assay is in 69, smells like late, I do it also in the middle and I take five system suitability samples, same samples, we make a mix of our endogenous and internal standard dice, right? So that’s 14 Bed tight. So I need 28 beds. And we look at the areas, retention times, all those things, right to be good before you go. Okay, you must analyze them a couple of times to set yourself.
Alright. So that so you get a ton of points right there. Okay. So you’ve got, you know, the number of analysts you need in order to expand your space, you’ve got the criteria that you’re setting. And so these are a lot of criteria around system suitability. The last thing you said that was interesting, which was, you know, you you need to set the values to begin with, right. So, that’s kind of the question and when do you how do you establish those values? And in the beginning, is it something that the vendor establishes for you? Is it something that okay? Okay, take five different SS five base. So that is, it’s the same as you walk into your internal standards, you take five points five different times, and then you set and then rapes and we put that in our system, and then that’s out of the race, what’s going to flag and this flagging too much? Maybe just set your range long as the USD free? Yes. Right. Okay, so you said so five, five runs on five different days. That sounds a lot like something you might do during a what? Method? Validation. Yeah. So. So, yes, so I think one of the most common times to establish your system suitability criteria is going to be during a method validation. Okay, so yeah, yeah. Yeah. So so we’re not going to talk a lot more. This is my this is my only bullet point on system suitability. They brought it up. Okay, so we’re not gonna talk any more about system suitability, so I don’t hurt my feelings, and his content is relevant because I like Mike. So we want to we want to Alright, so no, no, no, no, it’s good. So I think my point here is that we need to have you know, baseline metrics, right. So you need to have system suitability metrics available. And as Mike is pointed out, we will be talking a lot more about that later. Later today. So having baseline metrics for logbooks for reference values for instrument, readback system suitability all critical just to have in your toolbox, have those things have those things available.
Slide #
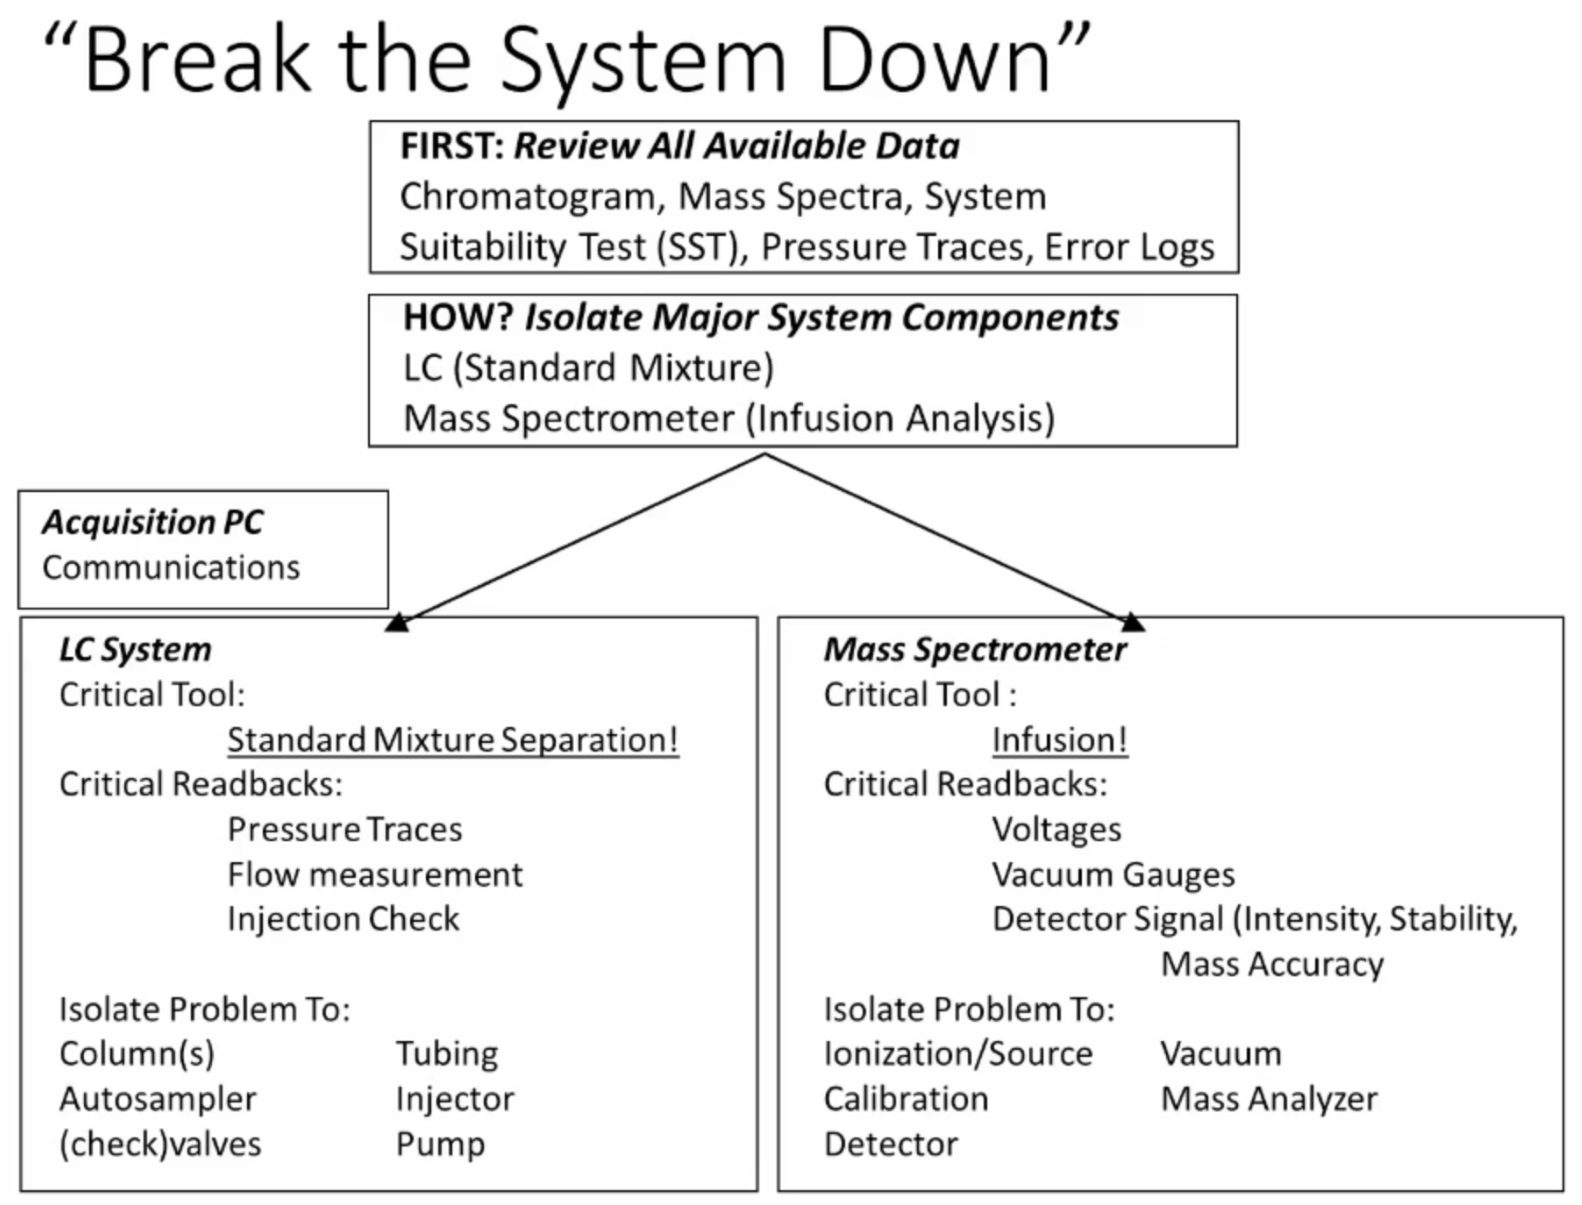 Okay, so now how do we go about breaking the system down, I said that what we have is a set of tools, which very simple sort of set of a list of criteria, which allow us to isolate the major problems potentially from the liquid chromatograph or the mass spectrometer, okay.
So the first thing we like to do when we walk in, and there’s red lights on, and the instrument not running, right, that’s the doomsday scenario, maybe after you walk out the door and go get a coffee and come back, you say we’re going to review our all of our available data that we have to us. So you don’t typically start by getting out a wrench and taking things apart, what you do is you’re going to sit down and review the chromatographic data that you have potentially system suitability or other QC data, standard curves from the day before analysis of samples. So looking at internal standard stability, those kinds of things, chromatographic data, look at mass spectral data. So if you have, you know, your mass spectrometer, you may look at analyte to internal standard ratios. you may look at, if you have multiforme, a qualifier, and a quantifier ion going to look at the ratios between the qualifier quantifier, you’re going to look at the other mass spectral data, like the system data, such as your vacuum readings, your readbacks on airflow, temperature, all the readings from your tune page. So all this data is available to you my absolute favorite troubleshooting tool, you get the pressure trace. So we’re going to look at a lot of pressure traces and how you utilize pressure traces, as in available data now, if we have any, and I hate to call us out in public, but do we have any Shimadzu with AB Sciex? Users? All right. So I will say that the data is relevant for you, but you don’t have access to it? I’m sorry. So that is a big thing. I think now that we really it doesn’t mean that you can’t effectively troubleshoot your system, it just is one tool. And my favorite tool that you don’t have at your access, right. So I think that’s something that can kind of communities, it’s a programming thing, it just needs to be addressed by the combination of Shimadzu with with analyst. The error logs then are also one of the things that you obviously, you know, clearly how many people have walked in, and you have an error log, and it’s like error 420 instrument shut down. And you’re like, What the heck is that? I have no idea. So, we’re going to talk a little bit about how to make use of those how to make use of those things.
So, the how is we want to isolate the major system components. The first simple thing is we have our liquid chromatography system is isolated the tool is the standard mixture separation or system suitability test. The second thing is for the mass spectrometer, we will perform an infusion analysis. Okay, so we can completely isolate the mass spectrometer just by doing the really scary thing of disconnecting the tubing that goes from the LC to the mass spec, and pulling it in with a syringe pump using a tuning calibration mixture. Okay, so that should be the first disconnect made if you’re trying to troubleshoot your system.
So for the LC system, the standard mixture separation or SST, you’re going to talk about the difference between kind of a global SST and Okay, great. So so you’ll, you’ll hear a lot more if you’re in the session this afternoon about the difference between a sort of global SST, that’s our universal SST that can be used on every instrument, and one that’s specific to the method, to the assay that’s being run. The critical readbacks are the pressure traces the flow measurement, you can do you know flow measurement on your system by you know, taking the flow, putting it into a graduated cylinder, you know, 100% A, and then switching to 100% B measuring the flow the accumulation over a certain period of time, right, so that allows you to measure the flow. So if pump A and pump B are delivering the accurate flow, you can do injection checks by either having a vial and having a set volume in the vial and then looking at that basically, injecting and then looking before and after comparing the volume, or you know, weighing that vial before and after the injection and telling, you know, the weight of the solvent that’s missing is the amount that you injected. Just these simple things here allow you to isolate the problem. Very specifically, actually, two columns are autosampler, check valves, tubing, injector pumps, any of the problems that you might be having in your LC system. We’re gonna go through some examples. We talked a ton of this, about this at the short course. We’re gonna go through some examples in just a minute on you know how We might go through this this workflow.
for the mass spectrometer the critical tools infusion. So, every vendor typically will provide tune and calibration mix for your instrument. run that tune and calibration mix and then look at the critical readbacks of the instrument itself which are voltages, vacuum gauges and detector signal including intensity, stability, sensitivity and Signal to Noise, and mass accuracy, especially for high resolution instruments mass accuracy is key for quadrupole instruments, you know, the resolution tune settings is more a determination or determinator of sensitivity.
This helps to isolate the problem to the ionization or source to vacuum to possible problem with your calibration, mass analyzers detector, all these things can be can be isolated just from doing the infusion.
Slide #
Okay, so here’s how the rest of this time today is gonna go. We’re gonna play a little game, all the red. So I have a few other sort of instructive slides thrown in here. But you’ll recognize that it’s your turn, when you have the big red box around the outside of the slides. If it’s a big red box, then I’m going to expect you to give me feedback. So this game is called Spot the Difference. Many of you may have played this in a bar or something where you walk up to the screen and you have to touch the difference between the two pictures. So that’s essentially what you’re doing every time you’re, you’re doing troubleshooting. In your lab, you’re comparing what’s good on one side and what’s bad on the other. So I’m not saying this is good, and this is bad, but there are clearly differences. So let’s start out who’s, who can find some differences here? Raise your hand. Shout them out. Yeah, okay. The woman in the right. Yep, she’s there and she’s not alright. Somebody else. You got it. You got it. You got another one over here? Yeah, leg of the man. Up and down. Yep. Anybody else? Yeah, here. I’m sorry. Yep, her hand is up and down. So this is Greg. This is Laura. That’s Lisa. Okay. So Okay. Yep. Sure. The window in the upper left corner. The frame, here and here. Yep. That’s when I didn’t. Yeah, great job. That’s not circle. That’s kind of that’s kind of like cropping error in. Fantastic. That’s got a special error name. Yeah, that’s great. Yeah. Very good. Very good. We’ve got somebody here in here. Yeah. So that’s Sarah. She’s back in the in the inside of our of our beautiful cube here. Should we get another one? If there’s another one? I really don’t. This is. Oh, yeah. Great. Yeah, we I forgot. We had not pointed that one out yet. Perfect. Perfect. Anybody else? You look, the angle of my cropping is not quite right. Either. This space is a little larger here than here. There’s all kinds of Don’t do me a favor. Don’t look around the edges. The edges may or may not. No, that’s great. Perfect. So you see how this is gonna go? I had five. And now I know next time I use this example. I need to circle this one up here for sure. Yeah, that’s great. So this is how this is going to go. All right, we’re going to work through some examples. We’re going to find some differences. The only difference now is that from here to here, after we do this, I want you to explain to me why the difference happened. Okay, so what is the cause of the difference you see in the picture, so that’s our how we’re gonna go.
Utilize the Pressure Trace #
So the first thing we’re gonna go through some details on how to utilize this pressure trace. Like we call it the HPLC heart monitor. Okay, so for doing reverse phase HPLC, or UPLC.
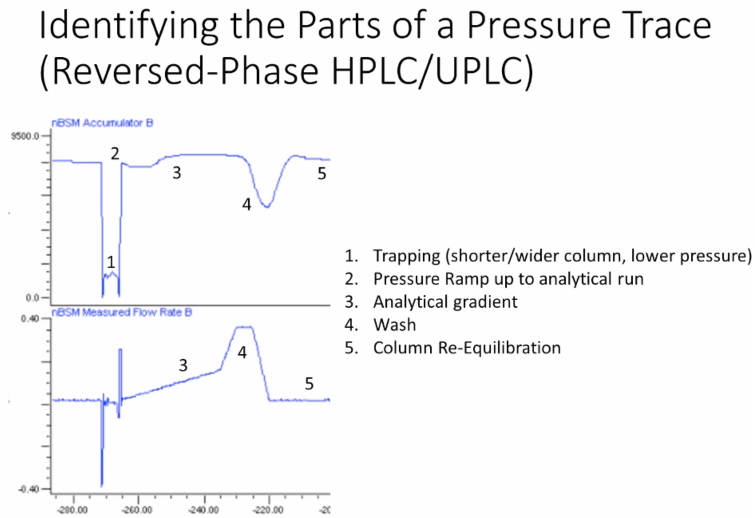 This is a trap loop configuration. So we have a slight additional complexity you may not see. So what we’re doing is we’re, we’re doing a D salting here through a shorter column. And then when we switch the analytical column in line, we see a pressure increase. So that’s the number two. Then as we’re performing our analytical gradient, we go through some maximum are talking a slider to about why we see this maximum. And then we’re going up in our to do our column wash, we have down and a decrease in pressure because of a decrease in viscosity. And then we’re going to reequilibrate. Okay, so for the purposes of my examples today, because the time I’m going to stick with reverse phase chromatography, obviously, if you’re doing HILIC chromatography, things look completely different because of the composition and mobile phase.
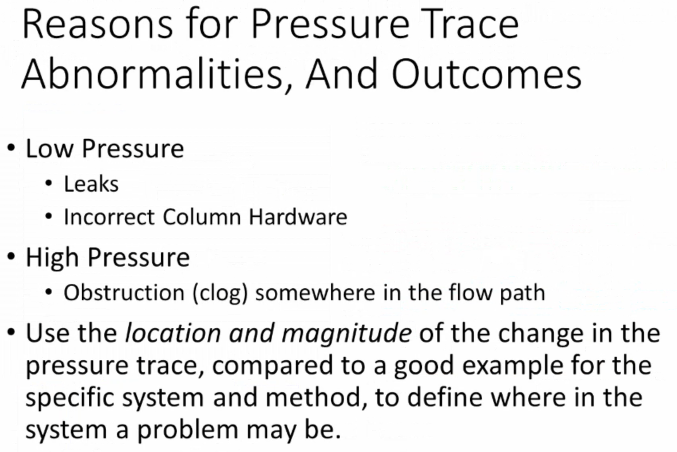
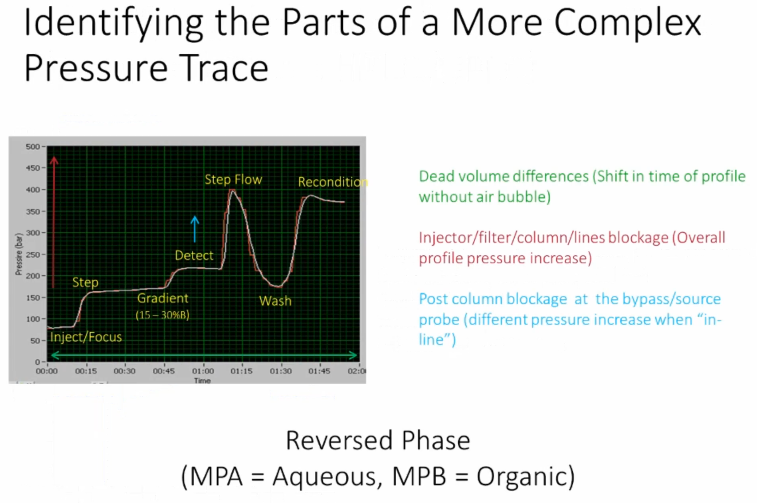 All right, we can also do some things you might see some pressure traces in here that are a little more complicated. So In this situation, this is something from Ross grants lab provided by Chris Shuford. So basically, we can do a similar thing where we're injecting and focusing on the column, then we step up the flow, right, then we are performing our gradient separation over this period. And the pressure goes up again, because what they're doing there is they have a post column valve, which switches in line with the mass spectrometer, so using their very narrow inner diameter tubing, so that causes a pressure increase during just during the detection, then what they do is they ramp the flow up again, in order to wash the column and perform the reequilibration. So this is the stepping the flow up, this is the column wash show a decrease in solvent viscosity at the same flow rate causes a pressure decrease and then they reequilibrate back to recondition. And at this point, they drop the flow down, and it would start with this injection focus, okay, so sometimes when you're looking at these pressure traces, that are going to look a little more a little more complicated, depending on what kind of valve switching and configuration and flow ramping you're doing in your method. The important thing is that you should be able to identify what is good and what is bad. So you have a situation here where you have the reference trace, essentially in white, and then a run simply in red. And so they overlay each other for that for that method.
Slide #

Pressure Trace Abnormalities #
All right. So reasons for pressure trace abnormalities and and the outcomes of those, what we typically will see is that low pressure is caused by leaks or incorrect column hardware, okay?
 High pressure is generally caused by obstruction, right? So we have a clog somewhere in the flow path. And then the you can use the location and the magnitude of the change in the pressure trace compared to a good example to identify and to find where in the system clog is going to be. Okay, so we’re going to talk go through some examples.
Slide #
 So you're up. Good luck to you. Where are differences here? Throw it up. between so this is good on the left. Bad on the right. What are you seeing what overall differences? Yeah, sure. Right here. Yeah, so Okay, so the one on the right side here is a little bit higher overall. Great. Anybody see anything else? That's pretty much that's pretty much it. So what we have is an offset between the left and the right. Okay, so what are what is the cost somebody else? Tell me the cause of this problem? Remember, you're now not just responsible for finding the difference. You have to tell me what happened. Give me some examples. There are several several things. sure. Something clogging the column or somewhere in the sea. Okay, good. So thinking about this method. Remember, what were we doing here? We switched in line with the with the mass spectrometer here, right? We were not otherwise. So where do we one place? We know it's not because everyone everything is overall up. what do we know it's not. it's not between the column in the mass spec, right? Because we switched the the mass spec in line the pressure is already increased between here and here or somewhere else so we can kind of rule out.
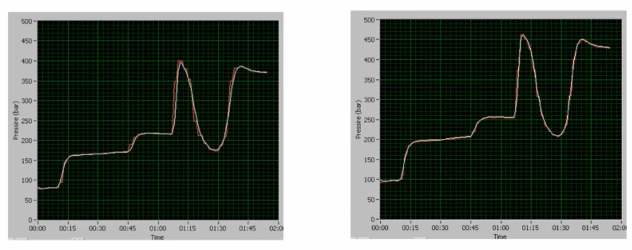
 all right, so in general, when we have a starting pressure here, which is higher, right, and you get a higher overall max pressure and everything is going up, it would either be in this case, if you're using a trapping system, it could be the trap or the column. Okay, so this is a column. This situation is basically just the inlet, the inlet column, inlet of the column, or the column itself becoming slightly `occluded??` over a large number of injection. So 2500, 2500 injections later, column is nearing the end of its usable life, we see a step up in pressure.
Slide #
Okay, next example. Find the difference. Yes, sure. Not necessarily bad thing, right? Because exactly right. Exactly as long what would we look at to tell if this is actually a problem or not? I’m sorry. Resolution of the column, what would we typically be doing in order to test resolution of the column? System suitability tests, right. So our SST is going to tell us whether or not this is acceptable. Right. Now, I’ve heard some people basically setting limits around their pressure as far as one of their SST criteria as well. In other words, we know if the pressure gets above this limit, that failure is imminent. Right? It may it’s a preventive side kind of solution, we would rather have, make sure that we change the column at four o’clock in the afternoon, then know that after the two more batches that are running overnight, we’re going to have a failure overnight. Right. So it can be used and written and recorded as part of your system suitability criteria. Other things, other than just chromatographic criteria, you might have pressure trace, you know, maximum pressures allowed, things like that. Any other questions on this example? Good. All right.
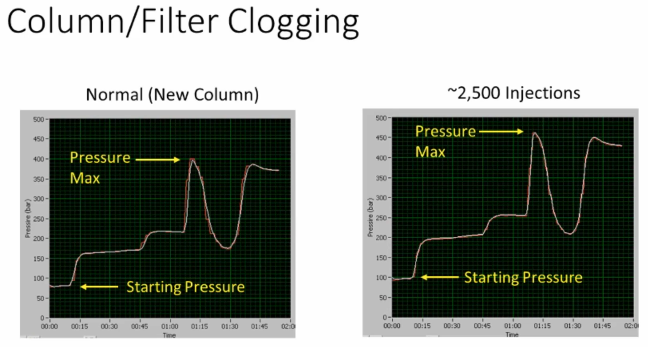
 Find the difference here. Maybe somebody in the back on that side? Find the difference. There is no difference here. Or is there? Back of the room over here? I'm looking at you were quiet group back there. Let's say from halfway through the back. Is it too hard to see from back there? We can. There's open seats up front? Just kidding. Okay, so this is good over here. And this is bad. Right? So the one on the right has got a pretty sharp dip. Yeah, right there. Right. So you see this drop? Very good. What else is slightly different? Other than just the drop? Same region, same area, same region? Yeah. Where's something over here? Slightly higher pressure there. Okay. So you know, it's hard with it. So you've basically got this axis. So we're after the second tick, and here we're kind of after the third. Yes, slightly higher pressure. Okay. So now we're on to the next stage of the question, what is the likely cause of slightly higher pressure early, and then a drop right at the time likely of the injection? Anybody got any comments there? What might be causing this? Sure. So for compressing an organic solvent, we might see a drop in the pressure, right? However, what do we know when we're mixing a little bit of organic either methanol, if it's a strong wash, for instance, or water? Or acetonitrile in with our sample matrix? What is that overall going to cause to happen? Cause in the pressure trace? Is it going to go up or down? What do we know about the viscosity of methanol water mixtures or acetonitrile-water low percentage is your natural water mixtures. Is it lower or higher than than water? It's higher, right? So this is actually what this pressure rise here is actually our this particular method. Inject samples in a mixture of isopropanol, acetonitrile and water okay, so this plug on this side, this pressure arise is actually due to that solvent simply hitting the head of the column going through a temporary, right and increasing column back pressure, and then resolving as we start this gradient here. Okay, so that drop is not likely to be caused by organic in the sample loop. But your close what could it be in the sample loop? My short course people come on, you know who you are? Sure. It could be a little needle wash could also be something if there's a damaged problem. Sure. Yeah, could be air, right? If we have air, then that's going to cause immediate this set as the solvent is compressed into that sample, right? Into the injection, you're going to have a have a drop in the pressure. Okay. So in this case, we've worked through the fact that so how did you how did you? So immediately, most of you guys went to injection? Right. And that was because of the position it was in the pressure trace early on, you saw a drop. Now, what about this sort of slight difference in initial pressure? Well, I haven't shown you have kind of this is little cheating, because I'm not showing you what happened immediately in the past before this. Right. But if you have a pressure, a pressure differential at the beginning of the run, what might that lead you to believe? Yeah, solve a problem. Maybe you didn't do maybe you didn't reequilibrate properly right right before that right before the injection, okay. So this was essentially a failed system suitability run, but it happened but for two reasons: a) there was a sample the system had been had been sitting for a while is basically and we did not reequilibrate. And we didn't prime the essentially the injector right? We didn't prime the sample, injector needle, the injection syringe, right? And watch solvents before the injection. Okay, so let's cause sort of two problems, two problems here. So we've got improper column equilibration and air in the injection loop happening in both scenarios here.
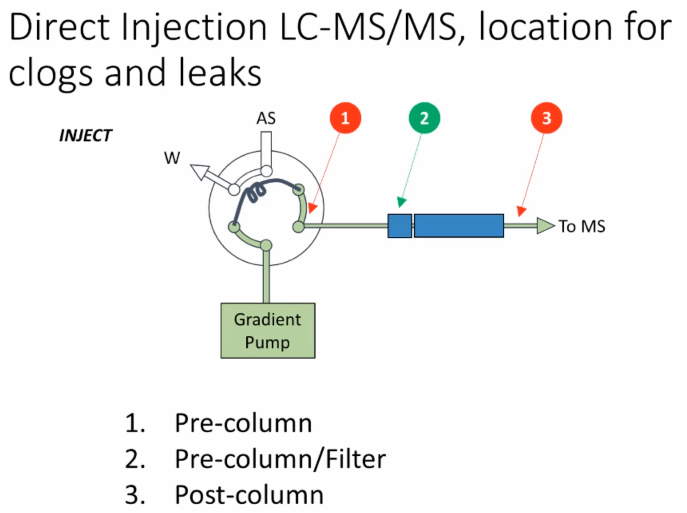 Okay, so now we're gonna go to some direct injection LCMS we've got a configuration here where we basically have a gradient pump we have a sample loop with this valve simple valve either switches to put the loop in line with the column or in line with the autosampler to bring to bring the sample into place and we're going to talk about putting some some clogs in locations. So here spot the difference should be pretty easy. Somebody want to shout out what are the different what the difference is here?
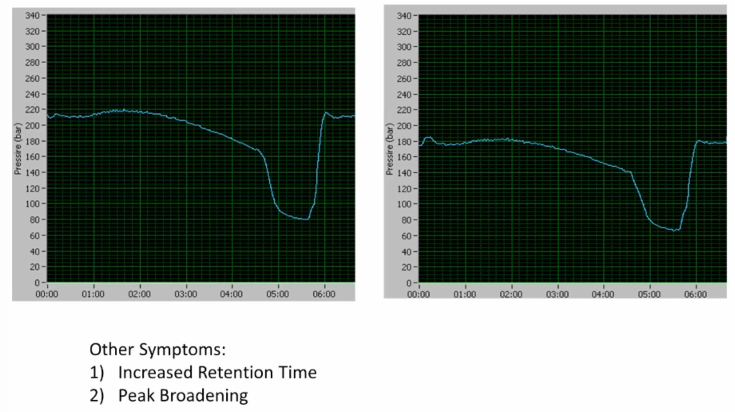 What's the difference? Yeah, overall lower on the right hand side okay. Some other symptoms that we have are increased retention time and peak broadening. So, what is the cause? So we have lower pressure increase retention time, and overall peak broadening. can be a leak where? Yeah, why? Just because I know you know it. Okay. So you have a pre column that's exactly right of pushing you a little bit on there, but you hit it now right on as you have a pre column leak is going to cause lower lower pressure, it's going to cause the solvent, essentially to not reach the head of the column for a slightly delayed period of time, right. So that's going to make your retention time lower. And then when we refocus on the head of the column is might be affected slightly. So we're, we tend to have a little bit broader peak width, right? Because of a pre column, pre-column leak. Very good.
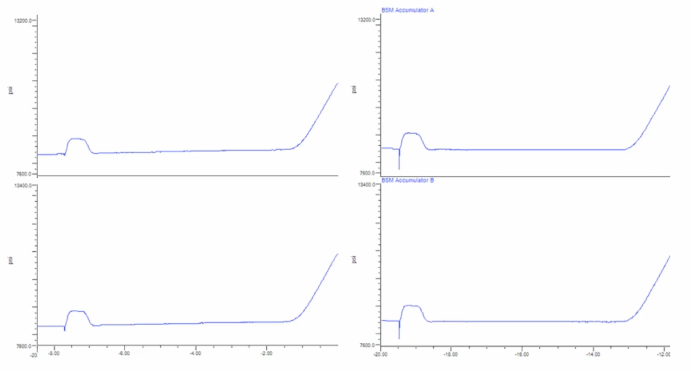
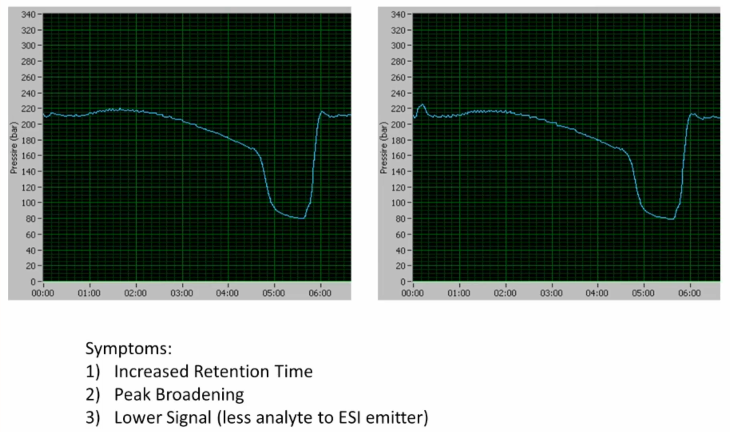 Okay. Here's another one. Symptoms are increased retention time, peak broadening, lower signal. What do we see in the pressure traces? Anything? that's consistent with these symptoms? So anybody see a difference at all between the left and the right? Yeah, sure. There is a tiny little increase of the injection here. Yeah, that is. That is a slight difference. Overall, though. Overall, though, these are very similar, right? Very similar pressure traces. So when we have a problem with our mass spectrometer, or with our system suitability, we look at our data and the very first thing we do is we look at the pressure trace, right? Unless you're certain users that don't have access to the pressure trace, but if you do, you look at the pressure trace, and we see no difference. So now what are we thinking? It's not a column problem likely, right? Because we don't see any differences in the pressure trace. Where are we going with this? Post-column? Yes. So elaborate a little bit. Why do you think post column still got the pressure going through the column? It could be a post-column leak, so long as you don't have any contribution to pressure whatsoever of the post column tubing. Right? So that's going to depend a little bit on your configuration. But most of the time, you're right. Okay. More importantly, then the leak, though, is something that may also lead to a leak, but it's going to really cause this peak broadening and increase retention time and what does that. So what often will generate what often will generate a leak? Yeah, so Exactly. So **an increase in post column dead volume, right is going to cause you to have a gap**, right? Maybe you improperly connected a fitting either at the column itself or at the electrospray probe. Alright, so those gaps after that are going to cause `increased retention time`, `peak broadening` and `lower signal`. Okay, so if you've got a post column leak, or a post column dead volume increase, that would cause those scenarios.
Slide #
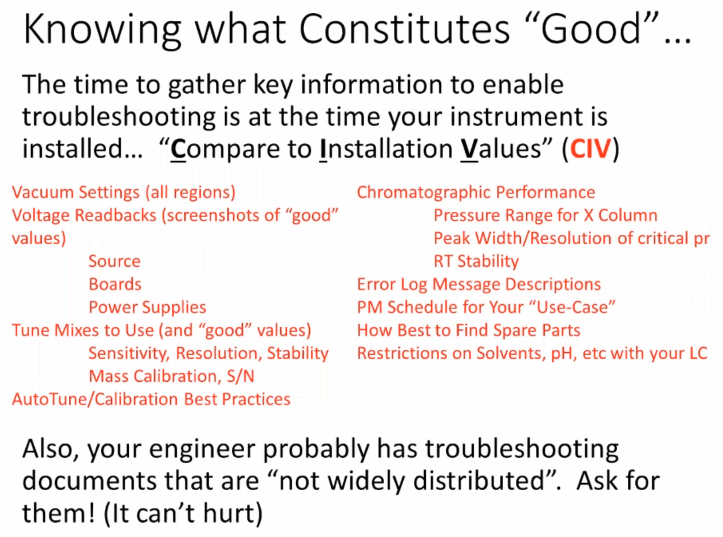 Okay. Last few examples we have. Yeah, and I'll go right, Judy? I'll go right up to that school. Yeah. Okay. Cool. All right. So knowing what constitutes good. So I talked about if comparing to the installation values, this slide basically just throws a bunch of stuff up on the screen that says what are the installation, let you know the installation values with respect to your vacuum settings, voltage readback, so else, or mass spec parameters on this side, `to nixes??` to use and good values. The bottom line is and then for the LC side, you have chromatographic performance, retention time stability, error log message description. So how do you get these error log message descriptions? When your engineers in the lab working on your machine, ask them to subtly leave the engineering tools on the desktop of the what is the absolute worst thing that can say? No, I'm sorry, I can't do it. How bad did that hurt? `Sue habits yeller??`, who I teach this course with HSMS. Her favorite thing is to actually suddenly ask and also suddenly leave cookies at the near instrument, or in the laboratory entrance, you know where it's safe to do that. She says that as exponentially increase the likelihood she will be able to. I'm not saying that engineers are open to bribes, but they do like people they do like people. So. So the worst thing in all honesty, the worst thing that can happen is they can say no. So ask the engineers when they're in your laboratory, either assigning, putting an instrument and doing the installation, or doing a PM or doing a repair, ask them to leave information to you that may not be widely distributed, right? Even if you don't actually know how to use that instrumentation and all that information at the time. Maybe there's engineering diagrams or other things. You never know when you might need it. Right? And so ask for that information.
Fitting #
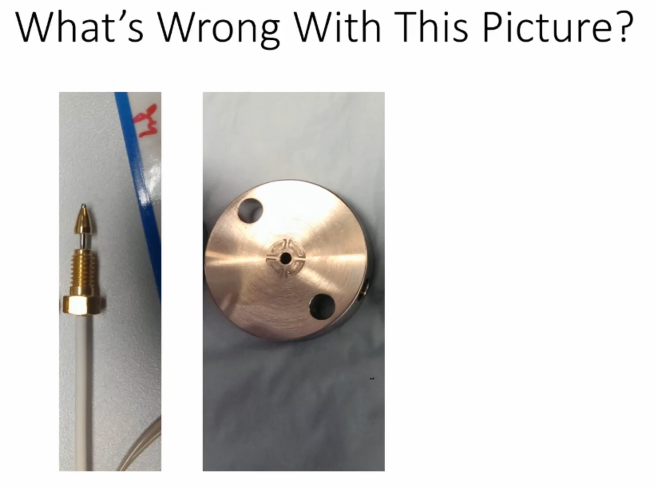 All right. The point of this is of these next couple of slides is `you may have a more difficult time identifying a problem if you don't know what good looks like`. Okay, so these are two examples I have. Obviously, you're not supposed to find the difference between these two things. That's too easy. But if you're looking at what on this on the left, does anybody identify what is wrong with this picture on the left? Short Course people you're not allowed to answer. Anybody know what the difference is? What's wrong here? Potentially damage here. Good. You're identifying what else looks kind of funny with this fitting? Sure. Yeah, so the tubing should be out a lot more right. So if you have this is sort of what it should look like going into the bottom of this 1/16th or on 1/30th fitting. Similar, it looks very similar if you have a standard one sixteenths fitting.
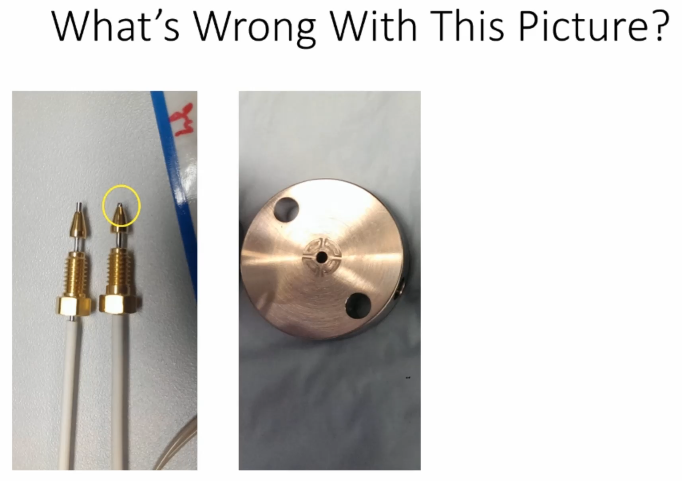 The depth of this is set by the valve that you are going into, okay. Each of those valves is machined typically, individually and they have slightly different depths. So it's not generally a good idea to use a fitting from one valve and then move it to another valve and utilize that there. You may have this as a chance at least that you'll `introduce some delay`. On, this was simply a fitting that was tightened down too soon. And basically the fitting was not all the way down to the bottom, Judy's got some great material and kind of how to do that properly, that let her do that.
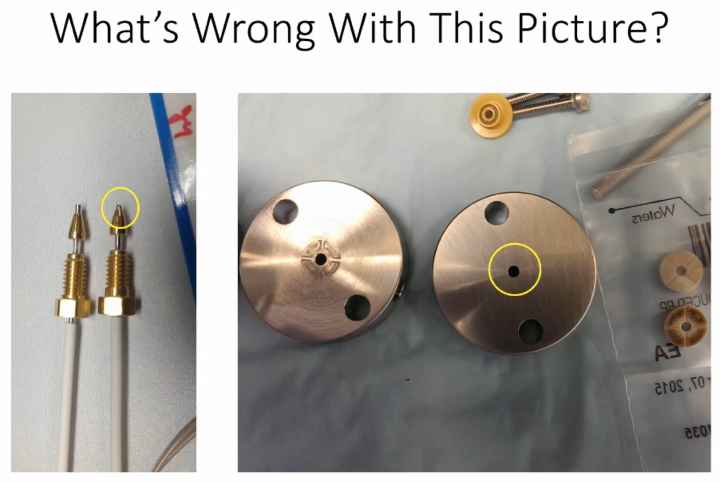 This one on the right is actually the backside of an acuity. Essentially, this is the retainer ring behind the piston seal, right, that holds the piston seal in place in the pump head, right. And this piston, this seal here had completely worn on this, essentially this stainless steel plate that goes in the back, okay, this was causing a leak around the piston sort of out out of the pump. If you don't know though, when you're taking this apart that you know, black and worn is bad, then you wouldn't know that would likely be the problem. So it's a good idea to kind of, especially if you have a system that has maybe had some damage to it, but there are good parts, keep the good parts so that you can kind of refer to them. As you are trying to troubleshoot the next problem that will happen because inevitably, the next problem will happen. We all hope it won't, but it will.
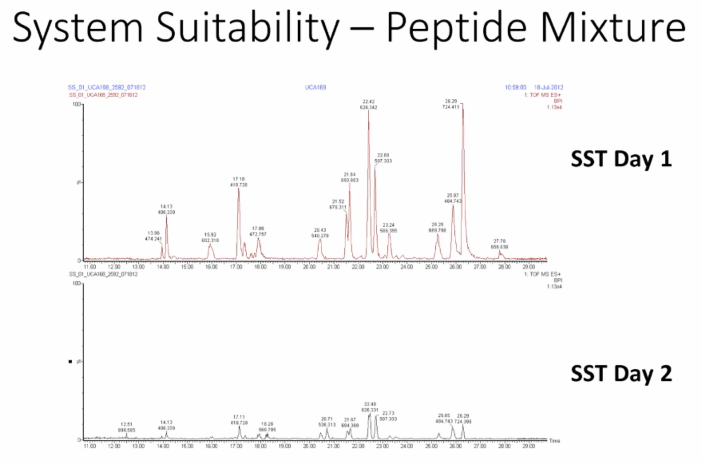 Okay. system suitability. So this is a peptide mixture that we run in our lab for as part of a system suitability tests. What we do is we extract do perform extracted ion chromatograms. And look at peak area if you continue to do those kinds of things. But what I've done is I've just shown you the overall base peak on chromatogram. And it's not too hard to find the differences between here. What we're going to do is go through three scenarios that could have caused this problem. And I think there's three and then discuss why that might be.
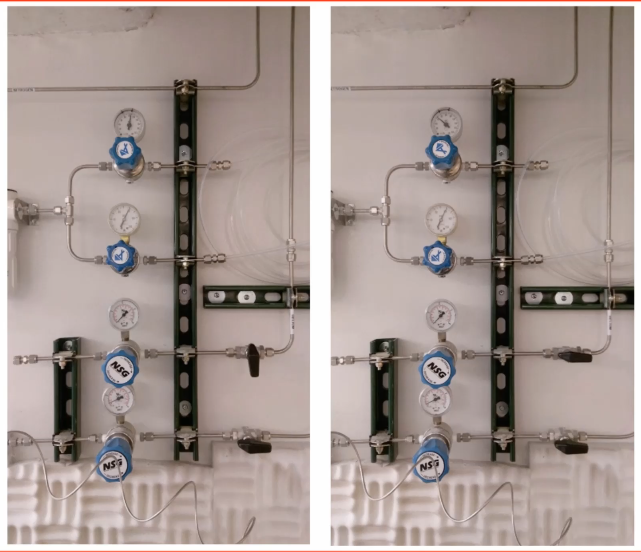 So you want to find the difference between these two. Why would want to things that may have caused the right side says a branch erroneous. Yeah, so we have a we may have a problem with gas with with gas flow, right? Because we have a much lower gas flow here. If you see we have our little range marked on this. So we might have to make sure we're in that range. Yeah. Yeah, yeah. Yeah. So we have a problem here, where maybe we've turned a gas on that shouldn't be on. The clue here is that we still have zero pressure on either one. So that's not likely to be the problem, even though we probably should put it should put it back. I'm not saying that most people are gonna go around the lab taking pictures of the wall configuration. But maybe, yeah, no Julie. But you know, having having this here, where you where you have the ability to at least visually have a visual indication of what constitutes a good setting. So you can quickly glance up on the wall and see if it's within the correct range. Clearly here, that might be a cause for the the problem. This is the next reason we might see the very same symptom.
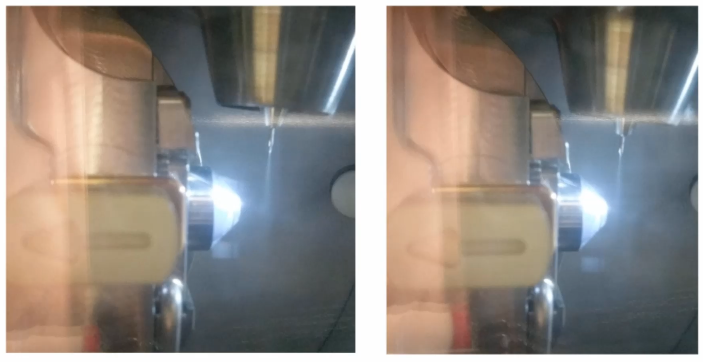 So who can pick out the differences in this picture? Yeah. good. So we have pro-position. So on the right, we're basically angling more towards the more towards the cone. So this is good performance. This is bad performance. Here. Anybody else see another difference? That might lead also to differences in performance? This distance is different. Yep. So that all is occurring, because this is basically moved in further. Okay. So anything you see that's different, that's not related to the just the change in geometry of moving in anybody else? So you might be only the people up in the front that can actually see. That's the difference. That is the game after searches after I leave that one in there. That's great. Good, no, good. Perfect. Perfect. anybody? Anybody else? Sure. Yeah, see what he noticed that. So right here, we have a difference in the amount that `the probe tip is sticking out of the nebulizer`. So we have a difference there, it's pretty easy to see. `That actually was not the cause of the decrease in sensitivity`. What was the cause of `the decrease in sensitivity` was that `the electrospray probe adjustment`, which was basically if you zoom in on the photo, you can see that this is kind of well, you can sort of see that this is sticking out.
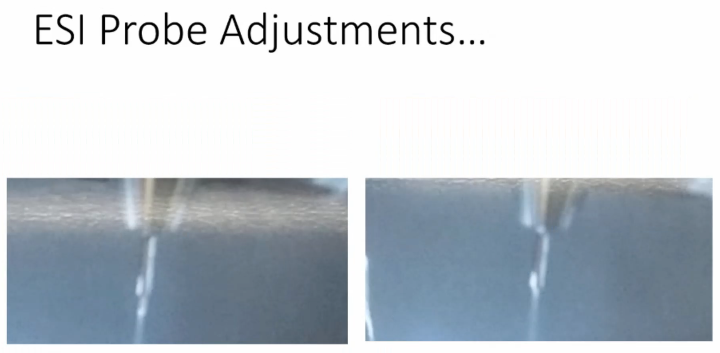 Maybe a millimeter and a half and this is barely protruding at all. So we're getting barely protruding on whistle blow sensitive this is `the low sensitivity`. So this is not properly adjusted for this simply configuration. And nebulization is not as effective.
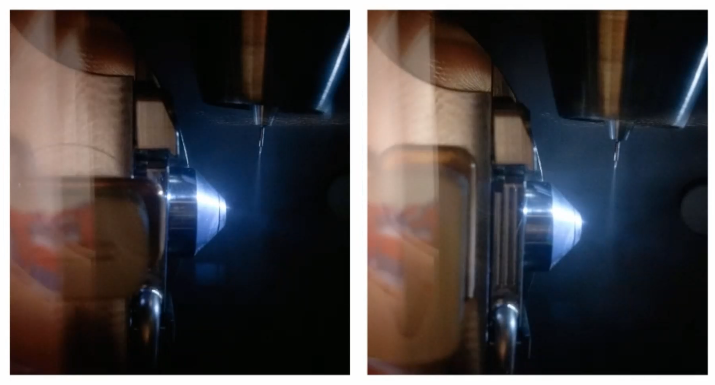 Okay, do the same thing again. So `decreasing sensitivity`. Actually, in this case, would you say it's a complete loss and sensitivity? There's zero signal on the one on the right. And the one on the left is good. Anybody uses Waters TQS or Waters source. Okay. You guys have a distinct advantage here over everyone else. Yeah, yeah. Anybody? You didn't focus over here, you were you would have gotten this one, you were focused on the left hand side. So yeah, so this one, we have done some cleaning and we `forgot to open up the bypass valve`.
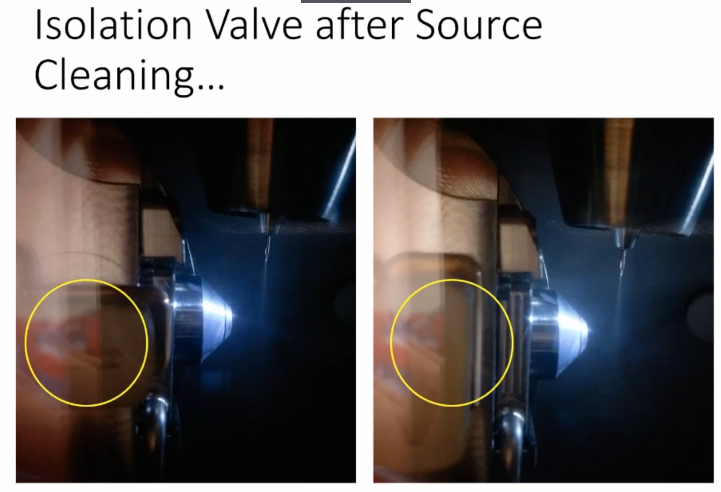 So basically, this is a valve that you close when you're doing this cleaning of this piece. You put this back in and you forgot to just switch that to it's open. So there's absolutely zero signal in this case, because there's no ion path.
Great. Alright, we’re nearing conclusion here or at the conclusion, in fact, special thanks to So Eric, sitting back in the back over there is contributed heavily to this course and teachers it was me here, Chris Shuford. And if anybody has not been to the meeting at Palm Springs, it is I’m not gonna say it’s equivalently beautiful as here but it’s very beautiful. So this is outside of Palm Springs MSCAL meeting. This is my buddy Scott. He’s Yeah, he didn’t do anything with the course but so anyway, and with that, I think will we pass over Judy or will do.