A problem well stated is a problem half solved.
- Charles Franklin Kettering
The first step is to list the potential root causes to the problem. Build a Fishbone (Cause and Effect) diagram if you wish. Below is an example
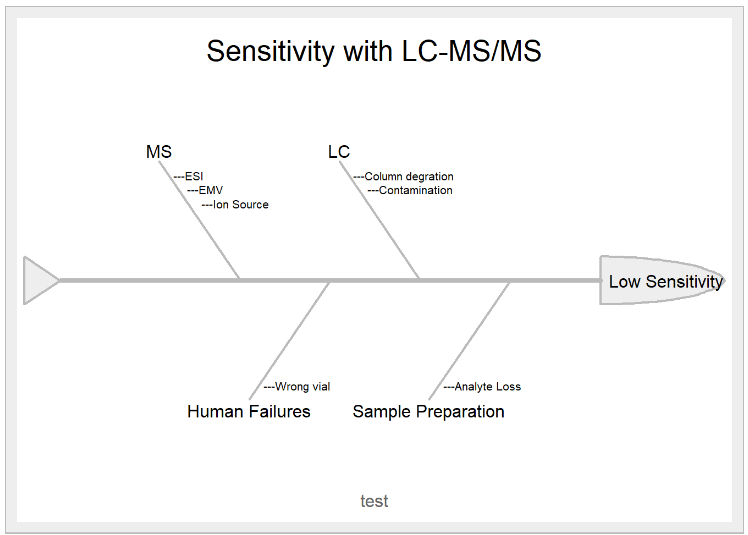
The causes are broken into four categories.
How do I know where I look into?
- Build up a system, so that each cause should be monitored and there were reference so that we know we deviate from it.
- Rule out easy cause(s) firstly
stateDiagram-v2
State1: Monitoring Parameters
(Establish baseline during method validation and
monitor the performance during routine analysis)
1) Spiked blank at LOQ
- Peak Area and Action Limits
- Analyte-to-Internal Standard Ratio and Action Limits
- Qualifier-to-Quantifier Ratio and Action Limits
2) Method Blank
- Contaminate Peak Area and Action Limits
3) Key parameters on autotune reports
- Infusion analysis
- Vacuum readings
- Readbacks on airflow
- Temperature
4) MS/MS
- EMV, ESI, vaccum gauge, mass accuracy
5) LC
- Pressure traces
State2: Troubleshooting Database/Logbooks
- Symptoms and solutions
- Searchable
State3: Maintenance Logbooks
- Replacement of column, mobile phase
- Preventive maintenace
State4: The error log
State5: Breakdown the System
1) Human Failures
2) MS/MS
3) LC
4) Sample Preparation
State6: Troubleshooting Tips
1) Make one change at a time
2) Go backward from the end to the beginning
State1 --> State5
State2 --> State5
State3 --> State5
State4 --> State5
State5 --> State6
stateDiagram-v2
State1: Troubleshooting Tools
1) Unscheduled method
2) Visual inspection of charts,
chromatographs, spectra
3) Run standard
4) Flow measurement
Part I Building up a monitoring system #
At the beginning #
The program starts at the very beginning when the instrument was commissioned. Collect the following information at its best condition.
) The instrument performance at its best condition. The best condition would be the time when the instrument was commissioned or the PM was conducted. Such performance includes, but not limited to, key parameters on the tuning report, such as electron multiplier voltage(EMV) of detector. Plot the parameters.
) The instrument response to pure standard at the LOQ level when validating the method. We would run ten replicates of pure standard every day for three days. Collect the following parameters, but not limited to, analyte to internal standard ratio, qualifier to quantifier ratio. Plot the parameters, establish action limit.
[Note: some people call this practice as system suitability test.]
) Setup binders of troubleshooting cases.
) Document (screen shot, print) acceptable peak shape for analyte(s) most sensitive to column degradation.
) Build up a database of problems and associated troubleshooting so that solutions can be searchable when needed.
Notes:
1. Prepare standard solutions in injection matrix in bulk, aliquot to autosampler vials and store ready for use at -200C (or best temperature for stability).
During the routine analysis #
On top of the scheduled preventive maintenance, the program is executed on a regular basics to monitor the health condition of instrument. ) run pure standard at the LOQ level, double blank, and method blank before run. Plot monitored parameters, and check the trend. ) Plot pressure traces.
Table 3 System Suitability Test Outline
Routine Actions:
1. 3-5 injections of pure standard(s) and blank in injection matrix (and internal standards if desired)
3. Compare means & %CVs to action limits
**Options** 1. Verify acceptable separation of peaks most sensitive to column degradation (if applicable). 2.
Part II Build up a troublshooting database #
symptoms, solutions, searchable
Part III Troubleshooting #
Level I: Easily-fixed problem #
rule out operator false, such as wrong injection,
They are:
) Operator failures;
)
Level II: complex problem #
) investigation.
) go over the monitoring charts, and compare the previous trend.
) discuss with the analyst.
) break the system down to LC and MS.
Troubleshooting workflow:
) rule out simple problem.
) isolate area. [sample preparation, mass spectrometer, HPLC]
)
)
Questions to be answered:
- Did electrospray ionization work properly?
- Did mass spectrometer work properly? [autotune reports, such as declustering potential, collision energy, collision exit cell potential, pressure]
- Did LC work properly? [mobile phase ageing
Steps:
- check mass spectrometer performance. (autotune reports, parameters, asymmetric spray (blockage))
Useful diagnostic tools:
- a known standard
- unscheduled method
- monitoring plots of internal standards, blank, instrument parameters
- infusion the tuning solution to check mass spectrometer
- check autotuning reports.
sensitivity change
make new mobile phase A with pH modifier(aqeuous solution) rational: the pH promote the charged state of the analyte over its neutral species. mobile phase was contaminated attributing to rising baselines, noise or spikes.
chromatography: