Broad peaks, often accompanied by a change in retention time, indicate band spreading. It can occur within the HPLC column, but is more often due to incorrect system plumbing. The following procedure describes a method for measuring the band spreading due to the HPLC system. Column effects can be measured using efficiency calculations.
-
Remove the HPLC column from the system and replace with a zero dead volume union.
-
Configure the HPLC system with the following parameters;
Flow Rate: 1 mL/min
Detector Sensitivity: 0.5 to 1.0 AUFS (ABSORBANCE UNITS FULL SCALE)
Detector Time Constant: 0.2 or less
Chart Speed (if req’d): 20 cm/min -
Perform a ten-fold dilution of the column efficiency test solution. Inject 5 µL of this diluted mix.
-
Adjust the detector sensitivity until the peak height is approximately 75% of the full-scale readout.
-
Measure the peak width at 4.4% peak height (5-sigma column efficiency method).
-
Convert the peak width to mL using the following conversion:
Band Spread (µL) = Peak Width x (1/20) x 1 x 1000
Where Peak width is measured at 4.4% peak height and expressed in cm;
(1/20) represents the chart speed, min/cm;
1 represents the flow rate, mL/min and
1000 represents the volume correction factor, µL/mL.
Important: 100 mL ± 30 µL is a typical system band spreading value. Larger values may indicate a problem in the detector, injector, tubing or fittings. Ensure that your HPLC system does not have built-in extra dead volume, as this will also increase the band spreading value.
- For high values of band spreading, troubleshoot your HPLC system then repeat the determination of band spreading. If the value decreases to acceptable levels, then the problem is resolved. A partial decrease will require further investigation.
If the problem persists, contact your instrument supplier for technical advice.
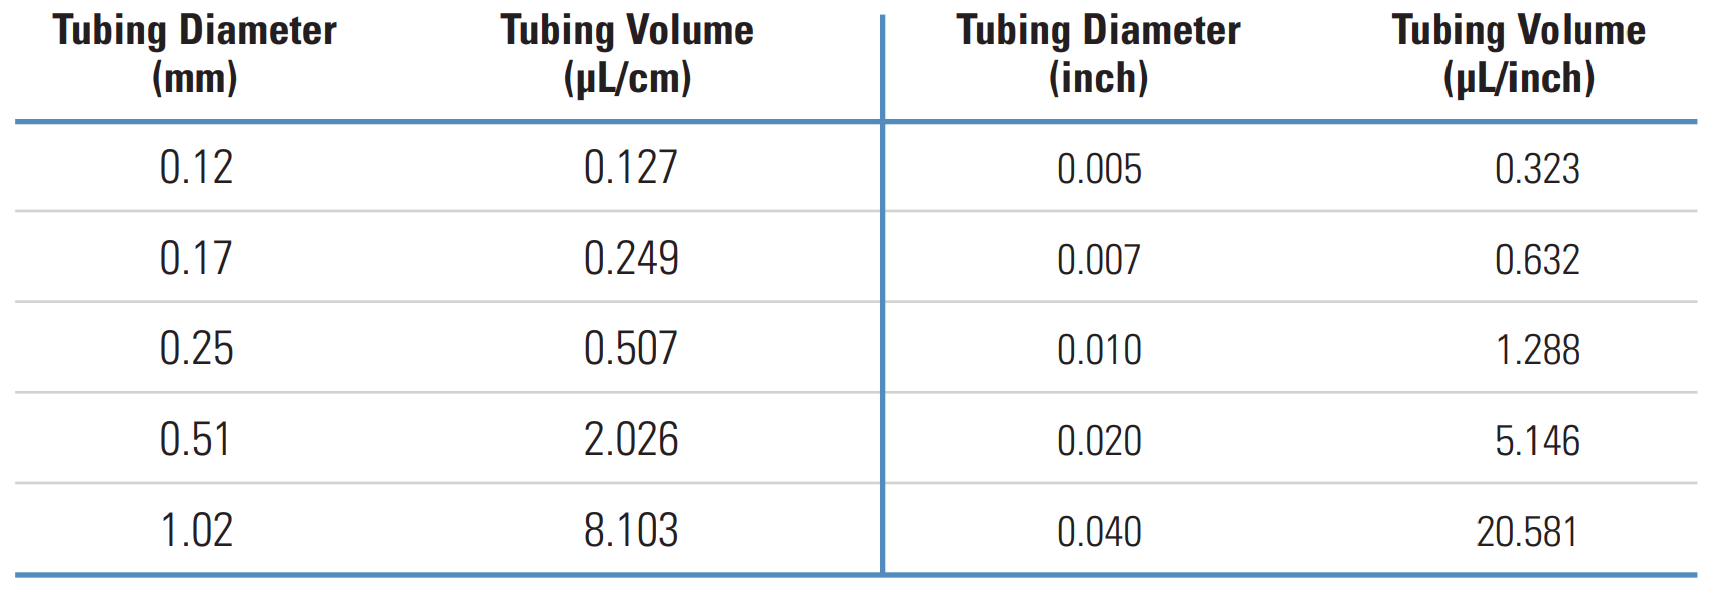
The table below shows details of the volume of solvent per unit length contained in tubing of varying volumes. For ease of use, both metric and imperial measurements are shown.