What is matrix effects? #
Matrix effects occur when compounds that are coeluted with the analyte interfere with the ionization process in the MS detector, thereby causing ionization suppression or enhancement in the electrospray ionization (ESI) source [1].
GC-MS is also subject to matrix effects [3].
What cause matrix effects? #
Compounds with high mass, polarity, and basicity are possible candidates to cause matrix effects [1].
The mechanisms involved in matrix effects have not been fully explored. One of the proposed theories to explain matrix effects is that the coelution of interfering compoundscause #1: coelution, especially basic compounds, may deprotonate and neutralize the analyte ions and, thus, reduce the formation of protonated analyte ions [1].
Another theory postulates that less-volatile compounds may affect the efficiency of droplet formation and reduce the ability of charged droplets to convert into gas-phase ions [1]cause #2: droplet formation due to less-volatile.
In addition, matrix effects may also be caused by high viscosity interfering compounds that could possibly increase the surface tension of the charged droplets and reduce the efficiency of droplet evaporation [1]cause #3: droplet evaporation due to high viscosity.
Moreover, unwanted compounds compete with analytes for ionization [2]cause #4: adduct ions formation.
How to assess it? #
Postcolumn infusion #
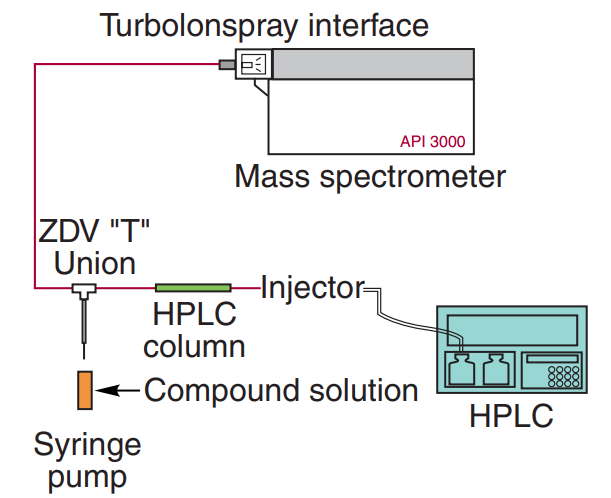
Identify the retention time region(s) where matrix effects were observed firstly, then adjust the chromatography condition to prevent analyte elution from from these regions.
Drawback. The process of postcolumn infusion is time consuming and requires additional hardware, and it is not appropriate for multianalyte samples [1].
Postextraction spike #
Drawback. For endogenous analytes such as metabolites (for example, Creatinine) blank matrix (urine or plasma) is not available [1].
How to correct it? #
-
Remove interfering compounds from samples [1,5,6,7,8].
Drawback. Most of the sample cleanup methods fail to remove impurities that are similar to the analyte and, hence, likely to be coeluted with the analyte [9, 10]. -
Dilute and shot
Drawback. This approach can only be feasible when the sensitivity of the assay is very high [4]. It will raise the limit of quantitation, which could affect the required sensitivity [3]. -
Change chromatographic parameters to avoid coelution of analytes and interfering compounds [11].
Drawback. Modifying chromatographic conditions can be time-consuming, and some of the additives used in the mobile phase to improve separation have been found to suppress the electrospray signal of the analytes [12,11,6,13]. Furthermore, even when the sample is devoid of coeluted substances, trace impurities present in the mobile phase can significantly suppress the analyte peak [15]. -
Change MS conditions to reduce the occurrence of matrix effects in the ion source [1].
-
The rectification of data
(i) the external-matched standards method [3]
Analytical standards are fortified in a sample extract that has been treated exactly the same as the regular sample and is free of the residues of interest [3].
Drawback. The matrix-matching technique requires many blank matrices and appropriate blank matrices are not always available for the preparation of external standards [6,9,10,14]. It is also impossible to match the matrix of the calibration standards with each of the samples exactly, as each sample has coeluting, interfering compounds that are thereby exposed to a different extent of ionization suppression [10].
(ii) the echo-peak technique
Drawback. Echo-peak does not compensate for matrix effects completely because both standard and analyte peaks are not eluted at the exact same retention time [9].
(iii) the internal standard method [1,3]
Drawback. The stable isotope–labeled internal standards (SIL-IS) approach is the best available option but it is expensive and standards are not always commercially available for the analyte of interest [11,6,14].
-
Standard addition method [1,3]
Drawback. Firstly, the approximate concentration of the analyte must be known to construct a proper calibration curve. Secondly, it requires at least three more additional sample runs per sample in order to have sufficient data points for the calibration curve [3]. -
Change from ESI to APCI [3]
Reference #
[1] LC/GC: Strategies for the detection and elimination of matrix effects in Quantitative LC-MS Analysis
[2] Systematic Troubleshooting for LC/MS/MS - Part 2: Large-Scale LC/MS/MS and Automation
[4] C. Ferrer, A. Lozano, A. Agüera, A.J. Girón, and A.R. Fernández-Alba, J. Chromatogr. A 1218, 7634 (2011).
[5] (1) E. Chambers, D.M. Wagrowski-Diehl, Z. Lu, and J.R. Mazzeo, J. Chromatogr. B 852, 22 (2007).
[6] (9) H. Trufelli, P. Palma, G. Famiglini, and A. Cappiello, Mass Spectrom. Rev. 30, 491 (2011).
[7] (10) R. Bonfiglio, R.C. King, T.V. Olah, and K. Merkle, Rapid Commun. Mass Spectrom. 13, 1175 (1999).
[8] (13) C.R. Mallet, Z. Lu, and J.R. Mazzeo, Rapid Commun. Mass Spectrom. 18, 49 (2004).
[9] (11) H. Stahnke, S. Kittlaus, G. Kempe, and L. Alder, Anal. Chem. 84, 1474 (2011).
[10] (18) A.K. Hewavitharana, J. Chromatogr. 1218, 359 (2011).
[11] (4) D.A. Volmer, LCGC North Am. 24, 498 (2006).
[12] (3) P.J. Taylor, Clin. Biochem. 38, 328 (2005).
[13] (15) F. Gosetti, E. Mazzucco, D. Zampieri, and M.C. Gennaro, J. Chromatogr. A1217, 3929 (2010).
[14] (23) M. Stüber and T. Reemtsma, Anal. Bioanal. Chem. 378, 910 (2004).
[15] (19) H.M.D.R. Herath, P.N. Shaw, P. Cabot, and A.K. Hewavitharana, Rapid Commun. Mass Spectrom. 24, 1502 (2010).