Video: 01 Fundamentals and Theory
Hello, everyone. And thank you for joining us today for this session of LC Ms. Ms. 101. The fundamentals. Today we’ll share knowledge are on the fundamentals of both chromatography and mass spectrometry, as well as explain key terms and analytical techniques associated with this technology. I’m Crystal Holt with sai x and I am your moderator for today. And today I am joined with our speaker, Dr. Karl Oetjen. Thanks for joining Karl. Dr. Karl oetjen is a senior scientist driving food environmental, forensic, clinical and cannabis applications at sciex. Before joining sciex He completed his PhD at Colorado School of Mines in hydraulic science and engineering were his research focused on nontargeted characterization of complex surfactant mixtures, including including aqueous film forming foams, which led to the discovery of several novel per and polyfluorinated alkyl substances also known as PFS, that since they’ve been found in a variety of environmental samples and industrial chemicals. Since joining sex, Karl has worked with numerous labs creating and implementing both quantitative and qualitative methodologies. Thank you again for joining us. We hope you enjoyed the presentation. And I’ll turn it over to Karl.
Thank you so much, Crystal. And thanks, everybody for being here with me today. So today, we’re going to be really talking about some of those fundamentals. So the way I kind of designed this talk was to focus on folks who maybe are new to mass spec, or someone who has been doing some mass spec and just wants to kind of refresh on some of the key variables in mass spectrometry. So if we just take off our science hat for a moment, and think about how just the general public interacts, and views mass spectrometry, so probably friends family, they might be familiar with mass spectrometry, maybe from something like a TV show. And in fact, if you have told anyone you’re a chemist, within the last, probably say about seven years, they’ll probably responded with Oh, like breaking that. And that’s fair. They did use mass spectrometry in Breaking Bad to test the purity of methamphetamine. That’s true. But mass spectrometry affects our lives in a variety of ways beyond just testing, testing drugs in a fictional TV show. It impacts everything from studying previous cultures, to understanding if there’s life beyond Earth, keeping us alive when we go under anesthesia, and all the way down to keeping our food safe for our pets and family and friends. So regardless of whether you’re a chemist, or you’re just a regular person out and out in the grocery store, mass spectrometry affects their lives every day. So the first thing we’re going to be talking about is really the separation. So before we get to the mass spec, we’re going to talk about the LLC portion. So this is really where the separation comes into play. In our next session, we’ll dive into some of the specifics. But here, this just kind of interior introduce some of these ideas. So in 1906, a Russian botanist first developed chromatography, and he was really interested in plant pigments. So he’s looking at pigments and plants. And that’s kind of where it chromatography gets its name. So it’s great for color writing. And since that discovery, it’s really branched into two specific fields. Or at least when we talk about organic analysis, two main fields, GC, and LC. So obviously, this presentation is going to really focus on LC, but maybe you’ve been familiar with GC, I know when I first started, I did a lot of gas chromatography. So maybe you’re switching over. And let’s just kind of touch on some of those key differences between gas chromatography and liquid chromatography. So the main difference that I would like to kind of instill is when we talk about gas chromatography, we really need our compounds to be volatile for that to be a reasonable approach for us to use, versus liquid chromatography, we need those compounds to be soluble. So that’s the really distinguishing factor of whether we’re going to go with a gas chromatography or GC approach versus an LC approach. Additionally, some kind of other interesting little facts for GC analysis, typically, we’re talking about relatively small compounds. Most of the time, we’re talking about sub 500 Daltons. So my background is in environmental science. So that’s kind of the area that I deal in. But I know many of you study things like polymers and proteins that are much much larger. So GC might not be great approach for those larger compounds really, isn’t it Compared to LC, where we can look at some of these really large compounds, so talking about things that are $100,000 Instead of just $500. But regardless of which approach you take, which one’s right for your sample, both are really quantitative. They’re both robust and reproducible. They’ve been around for a long time, and we use them all the time in the lab to complement each other.
But let’s get into LLC. So what makes up an LLC, so let’s start with the top. First, we have our mobile phases. So we typically have two mobile phases. Our first mobile phase would be mobile phase A, this is typically some sort of aqueous mobile phase, and a second mobile phase, which will be commonly referred to as organic or mobile phase B. And the way we’re going to introduce these mobile phases into our system is via a pump. So I just drew a little diagram of a binary pump system here. So when I say binary pump, all I mean is that one pump is for the organic one pump is for the aqueous. So from our element bottles, we have our mobile phase moving into our degasser. And our degasser is simply doing exactly what it sounds like it’s doing, it’s removing gas. So maybe previously, you’ve seen people in the lab, Sonic eight Elio bottles to get the bolts out. With most modern systems, now we can just rely on this to gas or to get those bubbles out. So we don’t have to do that extra step. It’s then moving its way into the mixer, which is, again, doing exactly what it sounds like it’s doing, it’s mixing our two mobile phases together. And this is really important, though, we want to make sure that we’re mixing consistently, and we’re mixing accurately. So typically, these mixers are pretty small in size, somewhere between 20 and 100 microliters, depending on your application. So once we move past this step, our mobile phase is going to make its way into our auto sampler. And just like any other auto sampler, this is really just saving us time, right? I know when I first started doing analytical chemistry, for my masters, there was a instrument I needed to use. And we didn’t have an auto sampler. So I had the luxury of sitting there with a stopwatch and every 20 minutes injecting a sample. So it’s come a long way, and it’s great that it has. So what we’re doing is we’re withdrawing some of our sample for LCMS analysis we can do anywhere from around a microliter all the way up to a millimeter and above, depending on what kind of your method is and your approach and what detection limits you need. But regardless, we’re loading that sample into our sample loop. And from there, once our valve switches, our mobile phase is going to push our sample out of that sample loop and introduce it to our column. And our column, or analytical column is really where all the magic and separation is occurring. So we store that column within the column oven. And the reason we’re doing that is just to make sure it’s at a consistent temperature. As we increase temperature, typically what we see is a decreasing column pressure. And also our airlines are going to move a little bit faster through that column. So I’d hate to see you know, a column B outside of a column oven, and then your AC kick on and your room gets a little bit colder, that’s going to mess with your retention time. So keeping it in a column oven a little bit above your room temperature is usually what I would recommend. But our analytes are passing through that column. And this is their chance to really interact with that column in some way. So what we’re going to want to do, or what we’re going to want to how we’re going to want to choose a column rather is to have the analyte of interest interact differently than the Analyze we’re not interested in. And a really easy example of this would be salts, salts, or aspects were sending me, we don’t want to introduce them in the mass spec, we wouldn’t be able to analyze them anyway. So an HPLC column or just an LC Comm, there’s going to be really no interaction there with salts, so they’re going to immediately just pass through a column or analytes of interest are interacting with the stationary phase. And we can divert that to waste. But how are analytes interact with that stationary phase is going to depend a little bit. And it depends on a few factors.
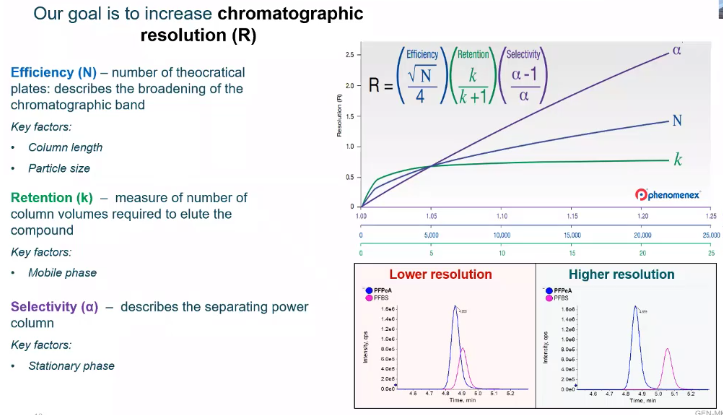 So here I have an equation for chromatographic resolution. And in the bottom in the red box, we have a lower resolution image and in the blue box, we have a higher resolution image. So what we’re trying to do is separate our peaks with MSMS. This is not as important to say he V with UV analysis if for peaks were superimposed. There’s not much we can do in terms of integration and quantification, we really need to separate them. Whereas with MSMS, we can kind of get away with this a little bit. But regardless, we’re always trying to keep separation between our piece
and the variables that we do for us to do this. One would be efficiency. So efficiency is the number of theoretical It’s kind of described the chromatographic band, but instead of thinking about it as a definition, I would rather us think about it as what factors are controlling that variable. So when we think about efficiency, some of the factors that really have a influence on that variable would be column length. So the longer a column, typically they’re anywhere from 50 millimeters to 150 millimeters, for just traditional HPLC. analysis. The longer that column is, the longer it’s going to take your analyte to move through that column. And that’s good thing, we’ll have more resolution as the column length increases or resolution increases, but it comes at a cost. And that cost usually is time. So if you have a 20 minute method, and using a longer column means you only have to add one or two minutes to your method, that might not be a big deal. But if you have a really short method, maybe three minutes, four minutes, adding a couple of minutes is, it’s a big difference, it could double the length of your minute or your method. So that’s something you kind of have to consider the same with particle size. So the way I like to think about particle size is with a larger particle size, we’ll have sort of wider peaks. And with a tighter particle size, we’re sort of sharpening up those peaks. So we’re increasing that area, or we’re increasing that height of the peak, essentially increasing the sensitivity, which again, great, some of the drawbacks are some of the compromises you need to make when you go to a smaller particle size would be column pressure, make sure your LLC can handle that sort of pressure. And also, if you have a really nasty matrix, I’m going to be talking about cannabis a little bit, which is just a truly awful matrix. The smaller the particle size, the more risk you have for running into things like clocks. Next would be retention. So retention is really controlled by your mobile phase. And that’s just the amount of column volumes it’s going to take for you to have your analyte of interest elute. So for LCMS analysis and HPLC analysis, we really focus on sort of like three major solvents are aqueous water, and methanol and acetic. Natural over next to common solvents that we’ve used in terms of inorganic, and they’re going to affect when your compound elutes a little bit differently. So there’s a little bit of wiggle room there in terms of what you choose as your mobile phase, but probably one of the most important factors. And if you look at that graph, you can kind of see, it’s one of the most important variables for chromatographic resolution would be your selectivity. And this is really your stationary phase, and how your compounds of interest and your comments that you’re not interested in, interact with your column. So during the mobile, the method development section, we’ll kind of go dive in deeper to specific column, stationary phases. But for now, I just kind of want to introduce some of the properties they’re using to interact with that stationary phase.
So here I have an equation for chromatographic resolution. And in the bottom in the red box, we have a lower resolution image and in the blue box, we have a higher resolution image. So what we’re trying to do is separate our peaks with MSMS. This is not as important to say he V with UV analysis if for peaks were superimposed. There’s not much we can do in terms of integration and quantification, we really need to separate them. Whereas with MSMS, we can kind of get away with this a little bit. But regardless, we’re always trying to keep separation between our piece
and the variables that we do for us to do this. One would be efficiency. So efficiency is the number of theoretical It’s kind of described the chromatographic band, but instead of thinking about it as a definition, I would rather us think about it as what factors are controlling that variable. So when we think about efficiency, some of the factors that really have a influence on that variable would be column length. So the longer a column, typically they’re anywhere from 50 millimeters to 150 millimeters, for just traditional HPLC. analysis. The longer that column is, the longer it’s going to take your analyte to move through that column. And that’s good thing, we’ll have more resolution as the column length increases or resolution increases, but it comes at a cost. And that cost usually is time. So if you have a 20 minute method, and using a longer column means you only have to add one or two minutes to your method, that might not be a big deal. But if you have a really short method, maybe three minutes, four minutes, adding a couple of minutes is, it’s a big difference, it could double the length of your minute or your method. So that’s something you kind of have to consider the same with particle size. So the way I like to think about particle size is with a larger particle size, we’ll have sort of wider peaks. And with a tighter particle size, we’re sort of sharpening up those peaks. So we’re increasing that area, or we’re increasing that height of the peak, essentially increasing the sensitivity, which again, great, some of the drawbacks are some of the compromises you need to make when you go to a smaller particle size would be column pressure, make sure your LLC can handle that sort of pressure. And also, if you have a really nasty matrix, I’m going to be talking about cannabis a little bit, which is just a truly awful matrix. The smaller the particle size, the more risk you have for running into things like clocks. Next would be retention. So retention is really controlled by your mobile phase. And that’s just the amount of column volumes it’s going to take for you to have your analyte of interest elute. So for LCMS analysis and HPLC analysis, we really focus on sort of like three major solvents are aqueous water, and methanol and acetic. Natural over next to common solvents that we’ve used in terms of inorganic, and they’re going to affect when your compound elutes a little bit differently. So there’s a little bit of wiggle room there in terms of what you choose as your mobile phase, but probably one of the most important factors. And if you look at that graph, you can kind of see, it’s one of the most important variables for chromatographic resolution would be your selectivity. And this is really your stationary phase, and how your compounds of interest and your comments that you’re not interested in, interact with your column. So during the mobile, the method development section, we’ll kind of go dive in deeper to specific column, stationary phases. But for now, I just kind of want to introduce some of the properties they’re using to interact with that stationary phase.
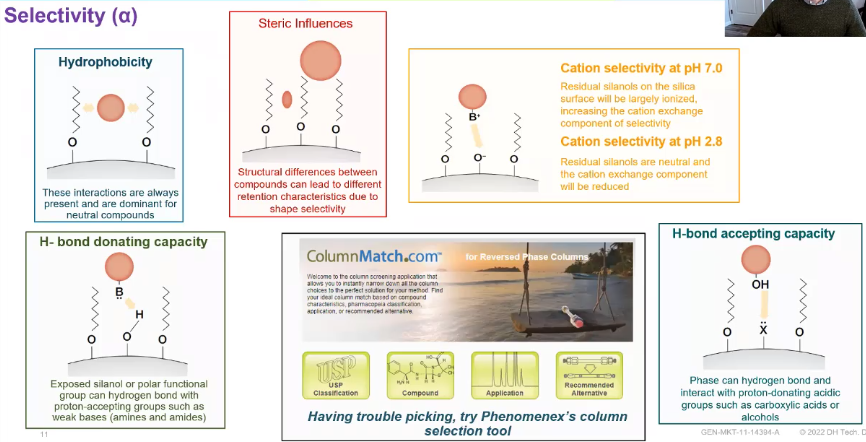 So some of the more common techniques that are used would be hydrophobicity. So this is great for neutral compounds, versus something like a steric influence and a steric influence is really more dependent on your compounds structure. So different structures will interact differently with that stationary phase, you can then get into something like an H bonding, an H donating H accepting an H donating capacity. And those are going to work for different compounds. For each donating, we’re talking about sort of amines and amides more basis versus accepting, which we’re talking about more acids. But regardless, we really want to choose a column that works for your analytes. So this can be And admittedly, it was for me when I first started and one of the more tricky parts of LC analysis, choosing the column that’s right for your method. So there are a lot of really cool tools out. I particularly like this one from phenomics called ColumnMatch, not just because it has a funny name, but you can actually enter in the structures of the compounds you’re interested in. And it will give you suggestions on what stationary phase might be best for that type of analysis.
But here would be a typical sort of chromatogram. So we have our peaks of interest. So all those colorful peaks represent individual analytes. This would be called an XIC, or an extracted ion chromatogram. We’re looking at a specific experiment, specific transitions, and we’ll talk about those experiments and then next couple slides.
So some of the more common techniques that are used would be hydrophobicity. So this is great for neutral compounds, versus something like a steric influence and a steric influence is really more dependent on your compounds structure. So different structures will interact differently with that stationary phase, you can then get into something like an H bonding, an H donating H accepting an H donating capacity. And those are going to work for different compounds. For each donating, we’re talking about sort of amines and amides more basis versus accepting, which we’re talking about more acids. But regardless, we really want to choose a column that works for your analytes. So this can be And admittedly, it was for me when I first started and one of the more tricky parts of LC analysis, choosing the column that’s right for your method. So there are a lot of really cool tools out. I particularly like this one from phenomics called ColumnMatch, not just because it has a funny name, but you can actually enter in the structures of the compounds you’re interested in. And it will give you suggestions on what stationary phase might be best for that type of analysis.
But here would be a typical sort of chromatogram. So we have our peaks of interest. So all those colorful peaks represent individual analytes. This would be called an XIC, or an extracted ion chromatogram. We’re looking at a specific experiment, specific transitions, and we’ll talk about those experiments and then next couple slides.
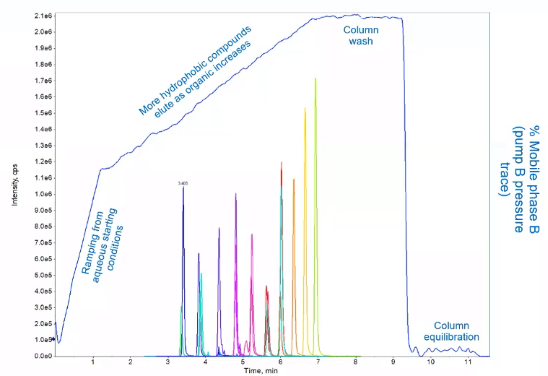 And in blue, we have our pressure trace. So our pump B pressure trace and if you remember from the earlier slide, that would be our organic pressure trace. And the reason I show pressure trace, instead of just percentage is because there’s pressure for pump the really core LEED silver is directly related to the percent B. So as we see the pressure increase, we’re introducing a higher amount of organic into our system. So a typical chromatogram, or typical LC gradient would have four phases, the first phase, we would start at a lower aqueous phase, so we’re introducing more water. Sometimes folks would choose to skip this step, it depends a little bit on your matrix, I like to include it just because that water will really help rinse off salts from your column and kind of ensure that it stays clean. But depending on the matrix, that might not be of concern. Next would be our ramping phase. So this sort of gradual ramp where our compounds are actually eluding, so we’re ramping from aqueous to organic, or compounds are beginning to elute. Then once their last compound has made its way off the column, we’ll hold it at a very high organic. And this is a really crucial step. So typically, we want to hold it anywhere from 95%. B, all the way up to 100%. B. And the reason we’re doing this is to essentially wash off the column. And the time it takes to wash off the column is kind of related to that retention. In the sense, we’re thinking about the same variable, how many column volumes it’s going to take. So your column volume is related to your column dimensions, so the length, the inner diameter, etc. So we want to make sure we get at least two to three column volumes of organic through our column. And that’s just going to ensure that all of those other analytes, the ones we weren’t looking for have washed off for column, we’re keeping our column clean, and we can use it for many, many more injection. Once that’s, that’s done, we’re going to do the Aquila Bration phase, another really important phase, which again, is related to the dimensions of your column. So we want to make sure we’ve gotten all that organic out of her column, and are starting our next injection at the exact conditions, we started our first injection. So if we choose to skip this step, what would happen is our column won’t be a clue calibrated, and our peaks will slowly start to creep up in a chromatogram. And we really want to avoid that and make sure that we have these steady retention times. So if we go back into the lab, we talked about our chromatography, we’ve injected our sample, it’s gone through a column we have separation, it’s made its way to a mass spec. And now you get to do our mass spec analysis. So everything up into this point has just been introducing the sample to your mass spec. Now we get to use the mass spec selectivity to actually quantify and use the data. But first, what kind of data doesn’t ask that K bus. And in the simplest terms, the mass spec is really looking at a mass, we’re reading the mass, and we’re getting intensity at a specific time. And I say mass or molecular weight, but really it’s a m over z. So it’s the molecular weight over the charge. And we’ll go over what that means in a little bit. And give some examples of that. But since we’re talking about ms ms in this talk, we’ll also have some fragmentation information. So how do we use this data? What kind of questions can we answer with this data? Because that’s the whole reason we’re doing it right? We have a specific question. And we want an answer to that question. And that question might just be how much? So we might want to use this data for quantification, which is one of the more common uses from aspect or MSMS data. But we can also ask some more qualitative questions like what is this compound and do some confirmation scans that we’ll talk about to be confident? Yes, this is truly the compound that I’m interested in. But before we get there, we got to start at the source. So how do we take from our LC, this liquid and actually get it to move through a mass spectrometer. And to do that, we use ionization. So electrospray ionization is probably the most commonly used LCMS ionization type.
And it was invented in 2002, by John Fenn, and some collaborators, and he was quoted as saying gave wings to molecular elephants, which is a quote I really like. Because if we think back to that GC, and LC diagram for GC analysis, we’re really talking about things.
And in blue, we have our pressure trace. So our pump B pressure trace and if you remember from the earlier slide, that would be our organic pressure trace. And the reason I show pressure trace, instead of just percentage is because there’s pressure for pump the really core LEED silver is directly related to the percent B. So as we see the pressure increase, we’re introducing a higher amount of organic into our system. So a typical chromatogram, or typical LC gradient would have four phases, the first phase, we would start at a lower aqueous phase, so we’re introducing more water. Sometimes folks would choose to skip this step, it depends a little bit on your matrix, I like to include it just because that water will really help rinse off salts from your column and kind of ensure that it stays clean. But depending on the matrix, that might not be of concern. Next would be our ramping phase. So this sort of gradual ramp where our compounds are actually eluding, so we’re ramping from aqueous to organic, or compounds are beginning to elute. Then once their last compound has made its way off the column, we’ll hold it at a very high organic. And this is a really crucial step. So typically, we want to hold it anywhere from 95%. B, all the way up to 100%. B. And the reason we’re doing this is to essentially wash off the column. And the time it takes to wash off the column is kind of related to that retention. In the sense, we’re thinking about the same variable, how many column volumes it’s going to take. So your column volume is related to your column dimensions, so the length, the inner diameter, etc. So we want to make sure we get at least two to three column volumes of organic through our column. And that’s just going to ensure that all of those other analytes, the ones we weren’t looking for have washed off for column, we’re keeping our column clean, and we can use it for many, many more injection. Once that’s, that’s done, we’re going to do the Aquila Bration phase, another really important phase, which again, is related to the dimensions of your column. So we want to make sure we’ve gotten all that organic out of her column, and are starting our next injection at the exact conditions, we started our first injection. So if we choose to skip this step, what would happen is our column won’t be a clue calibrated, and our peaks will slowly start to creep up in a chromatogram. And we really want to avoid that and make sure that we have these steady retention times. So if we go back into the lab, we talked about our chromatography, we’ve injected our sample, it’s gone through a column we have separation, it’s made its way to a mass spec. And now you get to do our mass spec analysis. So everything up into this point has just been introducing the sample to your mass spec. Now we get to use the mass spec selectivity to actually quantify and use the data. But first, what kind of data doesn’t ask that K bus. And in the simplest terms, the mass spec is really looking at a mass, we’re reading the mass, and we’re getting intensity at a specific time. And I say mass or molecular weight, but really it’s a m over z. So it’s the molecular weight over the charge. And we’ll go over what that means in a little bit. And give some examples of that. But since we’re talking about ms ms in this talk, we’ll also have some fragmentation information. So how do we use this data? What kind of questions can we answer with this data? Because that’s the whole reason we’re doing it right? We have a specific question. And we want an answer to that question. And that question might just be how much? So we might want to use this data for quantification, which is one of the more common uses from aspect or MSMS data. But we can also ask some more qualitative questions like what is this compound and do some confirmation scans that we’ll talk about to be confident? Yes, this is truly the compound that I’m interested in. But before we get there, we got to start at the source. So how do we take from our LC, this liquid and actually get it to move through a mass spectrometer. And to do that, we use ionization. So electrospray ionization is probably the most commonly used LCMS ionization type.
And it was invented in 2002, by John Fenn, and some collaborators, and he was quoted as saying gave wings to molecular elephants, which is a quote I really like. Because if we think back to that GC, and LC diagram for GC analysis, we’re really talking about things.
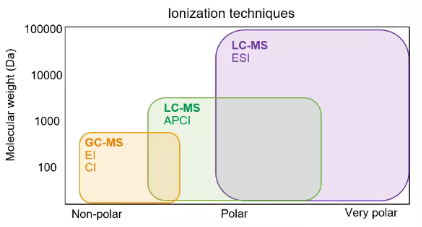 So 500 Dalton’s and you know, folks that are interested in these large proteins. They might say, I don’t have anything below 10,000 Daltons. ESI really gives us the ability to explore that world. And for ESI, we’re really talking about polar compounds. So we’re talking about that polar to very polar range, versus typical GCMs where we’re dealing with those nonpolar compounds. And you’ll notice I have another type of LCMS ionization there APCI. So if you’re from the environmental, or maybe even the forensic world, you might have heard of APCI and APCI, I like to describe as bridging the gap. So APCI allows us to look at some of the nonpolar as well as some of the polar compounds. So it can be good for some of those historically GC compounds. But it really allows us to kind of cover this full spectrum of polarity. So how does it work? On the left, we have an iron source. And on the right, we have just a little schematic of how that iron source is working. So you’ll notice in the image and the diagram, you see this capillary or this tube, surrounded by two heaters. So our LC is pumping, the solvent, the our analyte of interest and the lines of interest, all through this capillary. And that capillaries essentially making a spread. And one of the things that’s really important in LCMS analysis is that we have a good spread. So if we think about, you know, standing outside on a hot summer day with a hose, and we’re just to open a hose and hold it upside down, and just let the water pour out of it, we’d have a big puddle on our driveway. Versus least where I live in Colorado where we have 10% humidity, often, it’s super hot in the summer, if I were putting my thumb over that garden hose and create a really fine spray, I wouldn’t run into the same issue. So we really want to make sure we’re having a consistent, conical spread. So we are spraying around and we’re applying a charge, the charge will apply here we’ll just talk about positive ionization. So we’re applying that positive charge to our analytes of interest. And we’re doing some evaporation to try to separate our solvent molecules. So if we think about that spray, right, we have these big droplets, and the droplet contains our analyte of interest things, we’re not interested in things that didn’t pick up a charge, our mobile phase, and we really want to separate that because we’re only interested in our ions of interest. So we want to pull those ions of interest through our mass spectrometer that way they be introduced, and we can do some experimenting with them. So all electrospray ionization is doing is helping us get that ion in a charge state. So we can now pull it through our mass spec. But there’s some important things to consider. Particularly with ESI, we really want to think about our charge state. For some of these larger compounds, you’ll notice that those end up in different charge states, so you may end up with a charge state of 10, for example. And then we also want to think about the ability of the bedspread move through our mass spectrometer, some of the things that we’ll consider during the method development stage would be what ionization type to use. So right now for all my examples will be in positive mode, because it doesn’t really make a difference in terms of theory. But when we get into the method development section, that’s where you might decide, hey, negative ionization is really how I’m going to get this compound to move through my mass spec. So just a quick example of a compound of interest, this compound has a mass of 146. If we’re doing a positive ionization, here, we would see a mask of 147. So we’re adding a plus one in this case, versus if we had a doubly charged on we’d see this divided by two. So instead of seeing a 147, or 148, because it’s two of the hydrogens, we’d see a 74. So when you’re dealing with some of these larger molecules, things like proteins and polymers, understanding charge dates really crucial, because you’re going to need to know what maths to look for. But now that we’ve introduced our airlines, we can really get into the mass spec portion. So this is where we get to do the real mass spec mass spec.
And at first, I’m going to be talking about quadruples. So quadruples were invented in the 50s by two German physicists. And we’ve been using them ever since because they’re really good at being maths filters. And the way they work without going into too much of the physics or too much detail is that we have four poles, right? So it has quad. And these poles have different voltages, so they have different RF and DC voltages. And we’re constantly changing those voltages and alternating them, so they have to a poles and two people’s, but our whole purpose in doing so is to keep the ion that you’re interested in, Let’s hypothetically say you really care about a mass of 500. So you want any ion with a mass of 500 or M over z within 500 to move through that quadrupole so what the The software and mass spec is essentially doing is applying voltages to do that. So you filter out those other ions that you’re not interested in. And really only retain that one interest or that one mass that you care about. So if we look at a little schematic of how that’s working,
So 500 Dalton’s and you know, folks that are interested in these large proteins. They might say, I don’t have anything below 10,000 Daltons. ESI really gives us the ability to explore that world. And for ESI, we’re really talking about polar compounds. So we’re talking about that polar to very polar range, versus typical GCMs where we’re dealing with those nonpolar compounds. And you’ll notice I have another type of LCMS ionization there APCI. So if you’re from the environmental, or maybe even the forensic world, you might have heard of APCI and APCI, I like to describe as bridging the gap. So APCI allows us to look at some of the nonpolar as well as some of the polar compounds. So it can be good for some of those historically GC compounds. But it really allows us to kind of cover this full spectrum of polarity. So how does it work? On the left, we have an iron source. And on the right, we have just a little schematic of how that iron source is working. So you’ll notice in the image and the diagram, you see this capillary or this tube, surrounded by two heaters. So our LC is pumping, the solvent, the our analyte of interest and the lines of interest, all through this capillary. And that capillaries essentially making a spread. And one of the things that’s really important in LCMS analysis is that we have a good spread. So if we think about, you know, standing outside on a hot summer day with a hose, and we’re just to open a hose and hold it upside down, and just let the water pour out of it, we’d have a big puddle on our driveway. Versus least where I live in Colorado where we have 10% humidity, often, it’s super hot in the summer, if I were putting my thumb over that garden hose and create a really fine spray, I wouldn’t run into the same issue. So we really want to make sure we’re having a consistent, conical spread. So we are spraying around and we’re applying a charge, the charge will apply here we’ll just talk about positive ionization. So we’re applying that positive charge to our analytes of interest. And we’re doing some evaporation to try to separate our solvent molecules. So if we think about that spray, right, we have these big droplets, and the droplet contains our analyte of interest things, we’re not interested in things that didn’t pick up a charge, our mobile phase, and we really want to separate that because we’re only interested in our ions of interest. So we want to pull those ions of interest through our mass spectrometer that way they be introduced, and we can do some experimenting with them. So all electrospray ionization is doing is helping us get that ion in a charge state. So we can now pull it through our mass spec. But there’s some important things to consider. Particularly with ESI, we really want to think about our charge state. For some of these larger compounds, you’ll notice that those end up in different charge states, so you may end up with a charge state of 10, for example. And then we also want to think about the ability of the bedspread move through our mass spectrometer, some of the things that we’ll consider during the method development stage would be what ionization type to use. So right now for all my examples will be in positive mode, because it doesn’t really make a difference in terms of theory. But when we get into the method development section, that’s where you might decide, hey, negative ionization is really how I’m going to get this compound to move through my mass spec. So just a quick example of a compound of interest, this compound has a mass of 146. If we’re doing a positive ionization, here, we would see a mask of 147. So we’re adding a plus one in this case, versus if we had a doubly charged on we’d see this divided by two. So instead of seeing a 147, or 148, because it’s two of the hydrogens, we’d see a 74. So when you’re dealing with some of these larger molecules, things like proteins and polymers, understanding charge dates really crucial, because you’re going to need to know what maths to look for. But now that we’ve introduced our airlines, we can really get into the mass spec portion. So this is where we get to do the real mass spec mass spec.
And at first, I’m going to be talking about quadruples. So quadruples were invented in the 50s by two German physicists. And we’ve been using them ever since because they’re really good at being maths filters. And the way they work without going into too much of the physics or too much detail is that we have four poles, right? So it has quad. And these poles have different voltages, so they have different RF and DC voltages. And we’re constantly changing those voltages and alternating them, so they have to a poles and two people’s, but our whole purpose in doing so is to keep the ion that you’re interested in, Let’s hypothetically say you really care about a mass of 500. So you want any ion with a mass of 500 or M over z within 500 to move through that quadrupole so what the The software and mass spec is essentially doing is applying voltages to do that. So you filter out those other ions that you’re not interested in. And really only retain that one interest or that one mass that you care about. So if we look at a little schematic of how that’s working,
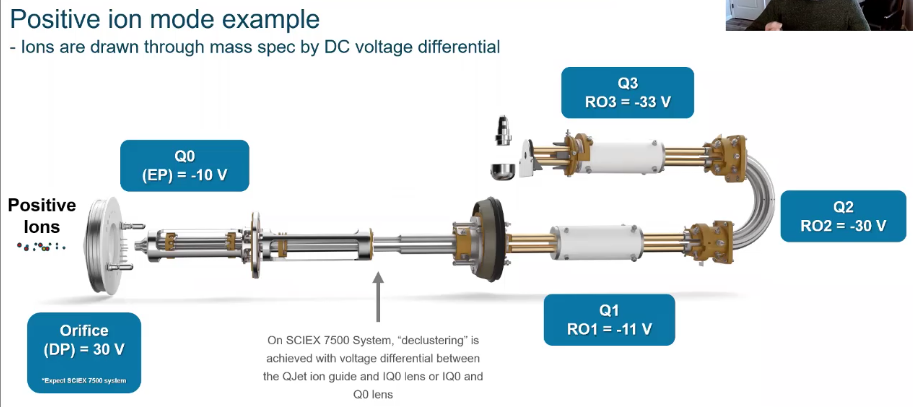 so here we have our positive ions, they’re moving through our triple quad. So we’ve got our Q1 agonist, the first mass filter, so these are all ionized using ESI, they’re being pulled through our first quadrupole. If we told the quadrupole to focus and filter out anything that’s not 500 M over z, everything else will fall out, and then it’ll be introduced into Q2, Q2, you’ll hear people refer to as collusion, so or Q2, and they’re both the same thing, you can use those terms interchangeably, it’s really just referring to where sort of that fragmentation happens. So instead of starting to use this quadrupole, as a filter, here, we’re going to be applying some energy to create something. And in our third quadrupole, that’s where we’re going to return to using that quadrupole as a mass filter. So if we take a second just to think about that selectivity, we have sort of a first mass or doing an experiment for a second or two that mass and then we’re filtering it again.
And that’s where we kind of get into some of this, this fun. So just a little brief about the background. But let’s talk about the questions that we can answer, because that’s the most exciting part about mass spectrometry, at least to me, are the questions that we can answer using it. So we’ve got our hands, let’s do our first workflow, maybe we want to do just some traditional quantification. So regardless of whether you have a triple quad, or acute trap, this experiment is going to work the exact same, you wouldn’t notice that you used a cue track over a triple quad unless you happen to look in the metadata or peeked over at your instrument and saw that there was a badge on it. That’s a cue trap. So what is it what is an MRM experiment? So MRM, multiple reaction monitoring, sometimes people just refer to it as MSMS. Here we are taking a parent or a precursor. And we’re selecting that or focusing on that parent precursor and filtering out everything else. You’ll often hear people refer to it as a parent, precursor, interchangeable parent is a little bit of an older term, typically, in literature, you see it referred to as precursor now. But they both mean the same thing. So we focus on some parent, and then we’re doing some fragmentation. So that’s all taking place in that second quadrupole, where we’re creating something. So we’re we’re using energy to essentially like to say bust that compound apart into fragments, and a fragment, or a daughter ion is what’s produced. And then in our third quadrupole, we’re going to be filtering for a specific fragment, or daughter. And again, daughter and fragment, you can use interchangeably daughter is just a little bit of a more an older term. So what does that experiment actually look like? So here we have our quadruples. We’ve got Q1 Q2, q3. So in this experiment, I’m only interested in that compound with an M over z of 215. So I’m gonna use my first quadrupole to filter out everything else and only allow my chief 15 into my collision. So in my collision, cell, fragmentation is going to take place, so I’m going to fragment. So here I’ve got four fragments I could choose from. And again, in our next session, we’ll really talk about how to choose these fragments and how to optimize for these fragments. But in this case, I’m going to select my 185. So using my IQ three, I’m going to only allow that 185 to reach my detector, well then get my intensity, and then I can decide to use that for my planification. Right. So that sounds great. But maybe it seems like a little bit of overkill to you, why not just use the first RM that to 15. Surely that should be selective enough. And in some cases, it might be, but in a lot of cases it’s not. And I’ve got an example here from some data I worked on with the customer. So this is actually in LG protein. Powder is pretty delicious. I didn’t taste it. But they were looking for pesticides in this algae protein. And they were looking at specifically for MGK 264, which is a pesticide that two isomers of this pesticide. So if we look at the green box, we see those two beautiful isomers everything looks great. But if we go on over to the matrix blank, so this is just the straight algae powder, with nothing in it. We see almost two peaks that look exactly alike are pesticides isomers, they are at different retention times slightly. But if I was an analyst in a lab, I would have a really hard time being confident that that wasn’t actually mgkg, six, four. It was, especially with those two isomer peaks. And because of the sample, we knew it was a clean sample. So we went ahead and spiked it, and we saw our pesticides appear. But again, going back to our LC section, we didn’t have the chromatographic resolution to separate them from that interference. So we ended up with this kind of odd backwards L integration, you know, I’m not super confident, I know that value isn’t going to be very accurate, that don’t have my nice Gaussian curve. I don’t really feel good about this dataset when I’m just using my MS data. So we looked at her MRM experiment. And what we see is completely different. So we’ve got our standard again. But then in our matrix, we don’t see anything. So that’s telling us that just using the MS experiment, we saw those interferences, right. So those interferences had the same parent maths as the compound we were interested in. So likely, they had a very similar formula. But they weren’t that compound. So the structure was different. Although the formula and parent maths were likely fairly similar. But using our MRM data, we can see oh, well, the fragment in form, there’s nothing there. And we get these two beautiful pesticide peaks in our spike sample that we can then integrate and feel really good about in terms of quantification. So the benefits are a mirror data, it’s really about the selectivity, like we showed sensitivity. And it’s a fast experiment. So, you know, I talked about having the chromatographic resolution, which is really important. You saw that with the matrix interference, but because these experiments and MRM experiment is so selective, it’s okay if you have overlapping peaks, because they’re looking for two completely different things. So that allows you to have these really large panels. So here’s an example of I’d say, a medium, maybe small medium panel of 81 compounds, go medium. And you can see that we have some big superimposed, but they’re looking at completely different experiments. So we’re not worried about it. And in terms of how long these experiments take, typically, the low end, we’re talking about around 10 milliseconds for dwell time. But, you know, obviously, we’d like a little bit more. So if you can keep it around 50, you’re usually in really great shape. But if we think about how many experiments you can do in a second of each one takes 50 milliseconds, right? It’s a lot. But what are some of the other questions you can answer with an MSMS experiment. So these experiments are going to be unique to Q traps, just as a heads up. So the only difference really between a T trap and a triple quadrupole is that Q three region. So cue trap, right quadrupole trap. Everything up until that q3 is exactly the same, operated in the same way. And then we have this trap. I like to conceptually think about it. I grew up lobster fishing, my grandpa was a lobster fisherman. So I spent a lot of time doing that. So conceptually, when I was introduced to the traps, that’s just how I envisioned it. And I’m sure that would break some r&d Scientists hearts. But that kind of works the same thing in terms of just explaining, we’re really trapping the things we care about in that trap and letting the other things that we don’t care about the vetra. And instead of doing it with nets and ramps for doing it with voltages. So what we can do is we can do some really cool experiments that we couldn’t do in just a traditional logical setting. So one of the experiments would be when we need to be highly selective. So how could you be more selective than an MRM experiment? Well, we can do M or M cubed. And just like it sounds, we’re taking a parent, we’re going to a daughter, then we’re going to a granddaughter, or we’re taking a precursor we’re going to a fragment, and we’re then we’re fragmenting it to another fragment. So we’re being very, very hyper specific to a specific compound structure. But what does that experiment look like? So here, we’re going to do the same thing. We’re focused on that 215. So we’re going to select that mass of 215 and pass it through a quadruple. And we’re going to do our fragmentation in Q2. But this is where it’s a little bit Different, here’s where we start to use that trapping function. So we’re going to select an ion of interest again that 185. And we’re going to trap it in our trap. Once we’ve isolated it, we’re going to go ahead and fragmented even further. So now we have the creation of these granddaughter islands. And from there, we can focus on a specific ion. So in this case, we’ll look at the 133. So what type of what type of scenario with this selectivity even be needed? Because maybe it seems like a little overkill right now. And there are two that I can think of that I use all the time. One would be in cannabis. Again, cannabis is a truly horrible matrix from an analytical standpoint. And the other would be looking at THC and hair. Another one of my least favorite matrices, it’s complicated. And it kind of just grosses me out, to be honest. But cannabis is just, it’s a tough plant matrix, we have high concentrations of cannabinoids, we have all these plant metabolites, it can be really challenging to look for pesticides in this matrix. So here we have an example of cycling through. So this is a pesticide that contains four isomers. So that’s why you see those peaks. Again, it’s going to depend a little bit on your chromatic graphic resolution, whether you see all four, or if you just see three. But we need to see this compound in cannabis at 10 parts per billion. And up top, we have a matrix blank, which has an interference that looks a lot like so from within. And down below, we have a spike to 10 DB V sample. So we can see Yeah, you know, obviously the intensity has increased. But I’m definitely not confident that that is truly Saifullah. So if we use a MRM cubed experiment, all of a sudden, we start to see Oh, and our matrix blank, we don’t see that interference. So that’s telling us, Hey, by being even more selective fees, whatever compound had this interference or looks like sci fi through and the structure was a little different. That fragment was a little different. So we didn’t have the exact same fragment. So when we fragmented that fragment, we ended up with a different result. And that’s why we have this clean matrix blank. But in our spikes sample, we all of a sudden see this nice peak. And that’s what we’re really looking for. And that’s where EMRAM cubed can be really valuable. But what if you don’t want to just do quantitation? What if you want to do qualitative studies and quantitative studies kind of at the same time, and I have a bias, this is my personal favorite workflow to keep track when we do some multitargeted security. So here, we’re going to do an MRM experiment, just like before, except we’re going to follow it up with an epi experiment. And it’s called an enhanced product ion experiment. So we’re going to be looking at fragmentation, and we’re essentially after the compounds fingerprint. So that’s what we’re trying to get after. What does this look like? So for an MRM epi experiment, we’ll start out with our MRM experiment. So here we have an Si Si. So we’ve got again, that extracted ion chromatogram with alert peaks, and we apply some sort of intensity threshold, and we’re looking for a compound that passes or surpasses that intensity threshold. If the compound doesn’t like that compound in the dark blue, we’ll just move on to our next MRM experiment and continue down the line. If it does meet that threshold, what we’ll end up doing is our epi experiment. So here’s where we’re going to create fragments and essentially read them out to get the compounds fingerprint. What does that look like in real life well in an animation, so again, let’s focus on that to 15. I am. So we’re filtering out everything else. We’re creating fragments and Q2. And here we’re going to do something a little different, instead of just using a single collision energy. So the voltage we use to create fragments, we’re going to actually use three collision energies. And the reason we’re doing this is to create a wide range of fragments. So we want as many unique fragments as we can get. So this is a nice way of dnn paths there, we’re going to allow those fragments to fill up the ion track, and then be read out by the software. And as those exit they’ll reach the detector and we’ll get there masses. And this will give us the compounds. I like to call it again fingerprint. So when would you ever need to do this. So this is another example of a sample a customer gave me this was a powder. It was a supplement powder from a certain type of grass. And again, they need to look at for pesticides. And what we saw in the grass sample, even in the blank was this compound that looks a lot like the next car. So it had a peak shape. That was great. It even had a Secondary MRM, that looked really close to make the iron ratio between the, the first MRM. And the second MRM. Very similar to the standard. The only clue that this wasn’t an oxy car, from our MRM experiment was simply that it had a different retention time. But again, not a hugely different retention time, it was about 12 seconds. So maybe my column was just getting a little old, or maybe there was something different about this injection that caused a little bit of an earlier retention time. Again, this 12 seconds would be a cause for concern, usually, we’d like to keep it a plus or minus six seconds. But still, you know me as an analyst, I’m not, I’m not overly confident that this isn’t phonexa car surely wouldn’t want to make a mistake and have this batch go out to consumers who then would consume what appears to be a large amount of this pesticide. So we did our epi experiment. And from our epi experiment, that’s where we realized, Okay, up top, we have a matrix blank. And then on the left or right hand side, sorry, we have a fragmentation pattern. So this is their compounds fingerprint. And if we look down below for phenoxy card, those fingerprints don’t match at all. So not only do we have the retention time difference, but we have completely different molecular fingerprints, I’m happy, I will go stand up, write a report, do anything, I’m 100% sure that whatever is in that matrix is not phenoxy car, I don’t know what it is exactly, I could go back and search some libraries and try to figure it out. But for the purposes of this customer, they just needed to know that it wasn’t phenoxy car. So although mass spectrometry kind of seems like it would be a pretty easy thing, at least in television, that a lot of steps to it. And we’ll talk about the steps in the upcoming sections. But this kind of just gives you an idea of what to expect. When we think about LCMS, we want to think about separation. So we’re always kind of focused on getting the separation chromatographic resolution for compounds of interest. But really the question we always want to ask ourselves is what question are we trying to get out of our data? Are we trying to be quantitative? What analyze are we interested in? That’s really going to affect everything we do in the method development section, and everything we do and how we process the data. So with that, I want to thank you very much. And I can take any questions.
Q&A #
Thank you so much, Karl, for the insightful presentation. And thank you for participating, and I hope you really enjoyed the content. And I’m gonna go ahead and start with the first one, Karl, which is around mobile phases, you mentioned that you sometimes include additives, specifically acids. And why do you include the additives? And if you are going to include an additive? How do you select which additive is best for your application? Yeah, absolutely. So great question. And actually, I have a couple of slides in our next presentation on this topic, specifically. So I encourage you just to check that out. But why are we adding additives at all. So we’re adding additives essentially, to change the pH of our mobile phase. And in doing so we help ionization, there can also be a couple of different tricks that you can use that aren’t just changing the pH. So one of the things I like to do again, you know, five backwards environmental I did a lot with Polymer analysis. For polymers, the ammonium addict is way more tense than AR plus H or sodium added. So I always like to add ammonium for me, because that helps promote some ammonium adducts so I can actually see the compounds and I’m interested in at a higher level. Excellent. Your comment on edX really drags into the next question. So if you’re having a problem with sodium ADOX, how can you reduce X How can you reduce particularly sodium, edX and MAs? Would new glass bottles help? Or is there cleaning techniques that should be utilized in order to reject reduce addict formation? Yeah, sodium, sodium adducts can be tricky to get rid of right and you hit the nail on the head with the glass. So it could be coming from your class. Another thing I would encourage you to try is try to experiment with a different source from your your mobile phase that you’re using for your aqueous so for example, if you’re using like an in house DI water, maybe try if you have milli Q or you know Goldstar would be to go and get some HPLC grade ms grade water from somewhere like maybe Fischer or sigma and give that a try and see if that can reduce some of this automatics using excellent it. The next question is around pressure. You talked about the pressure traces specifically for mobile phase A and for mobile phase B being seen? And can you comment on what you might anticipate as you increase your organic composition? What pressure change might be expected? And is that variable between types of organic mobile phases? Like if you’re using a pseudo nitrile versus methanol? Yeah, great question. I saw that question in the chat. And it makes sense. You’re, you’re absolutely right, right. Your pressure would be less with something like an acetal Nitro, methanol. But the way I was showing it was just the pressure read back from that one pump. So the way I had that pump set up was there, two binary pumps, so each has their own pressure. So that’s why you see this increasing amount of pressure from pump be even though maybe your total pressure is going down. So hopefully that kind of answers your question. Great. Now, we’re moving on to some mass spectrometry questions from some chromatography based questions. What if you don’t know the parent ion that you would like to generate an MRM type of analysis on? What strategies should you use in order to determine and can you create an experiment, a mass spectrometry based experiment without knowing the precursor mass or pairing on before? Yeah, good question. And again, we’ll go over that for sure. In the method development section, but there are a couple of approaches you can take. And it really depends on the question you’re trying to answer. So if you’re trying to quantify something, presumably you have a standard for that. So the easiest thing to do would be to go ahead and infuse that standard. And then just do an experiment where you scan for sort of a predicted mass range. And we’ll talk about in the next session, how to how to define that predictive mass range. But a simple example would be if you know, your standard has a mass of 500, you would set your first quadrupole, to look for from 495 to 525, to make sure you account for semantics, and also you see as many forms of that compound as possible. That being said, on the other hand, if your question was more into the, I have this unknown sample, and I don’t know what I want to look for, with a cue trap, you could do some unknown screening, where you’re essentially kind of doing the same thing that I was talking about with your MRM experiment, except you’re using the trap to enhance some of the ions around and then using that intensity threshold just like before to do your MSMS experiment, and it will do that based on whatever feature it sees. That’s above that threshold. Excellent. And next similar question around choosing the best precursor ion. What if you have a probative molecule and a couple of attic formations? How do you select which particular ion you should use as your precursor ion? Yeah, again, I’m excited because this means that the next session is going to be really good. So the way I do this, is I choose them all. And I choose them all initially until I get into a matrix. And I think what you’ll find is that different parents may have different interferences that you don’t experience with, say an Imodium addict. You see it with a plus h or sodium. So until I’ve run my sort of spikes sample in my desired matrix, I keep them all there and then choose the best one afterwards, based on intensity, usually your signal to noise. Excellent. The next question is around the fragmentation. You may get multiple fragments from a precursor ion, how do you choose what out of the different fragments that you get you want to take on to use in your final methodology? Yeah, and it goes to the same point, I would choose them all? Well, within reason, right? If there’s 15, probably not 15, but choose at least the top five. And if you’re working with a particularly challenging matrix, maybe something like serum or some sort of environmental matrix or blood, choosing them all and then spiking them into the matrix that you want to actually analyze is typically the best way I’ve found and then using that signal for noise to decide which which are in gives you the best sensitivity. Excellent. I can tell everybody who’s joining us today is really going to benefit from the next session as well. So I really am excited for you guys to sign up and join that. The next question is around chromatographic resolution and what is sufficient or appropriate chromatographic resolution and chromatographic separation for when you’re utilizing MSMS and how do you balance those two? Really good question. And it’s definitely something that it’s gonna depend a little bit. And I know that’s a tough answer to hear. But it’s going to depend on what you’re kind of experiencing. So typically, if you’re dealing with sort of trace level compounds, having your MRM superimposed, isn’t really going to make a huge difference. But if you’re dealing with compounds that are in high abundance, what you can have is some suppression occurring. So because you have two compounds at high abundance coming out at the same time, you can only i&i So many things at once. And you’ll notice that you’ll have some source suppression. So we see it all the time with pee fast analysis. Once the concentrations get too high, we have some suppression. So we have to make sure our chromatogram is spread out sufficiently that we don’t experience it. But when I do my trace pesticide analysis, that’s no longer a problem. So I’d say it’s gonna depend a little bit on the levels you’re after. Excellent. We have a question around the epi analysis, using the Q trap technology. How do you select the appropriate collision energy when you are utilizing an API, which looks at more than one fragment? Great question. So the default for sciences is 35 volts, which that usually works really well for most small molecules. But as you get into some of these higher molecules, things like or higher weight things, so maybe you’re doing some polymer analysis, 35 might really produce any fragments for you. So you might need to increase that. So typically, what I would do is start with 35. And then the for the three collision energies, you’d be plus 15, minus 15. Usually what I do, and simply because that matches the library that I use, which is the science library, but if you’re looking interested in some of these larger molecules, it might be worth playing around with collision energy and increasing them. So usually, as you deal with larger and larger molecules, you’ll need to increase the collision energy as those molecules get larger. Great. The next question is around matrix effects. How does how does different matrix and different matrices impact and production and inefficiency? Yes, the answer is a lot. And this is where we’ll have to rely on a few different mass spec tricks, and then a few different chromatographic tricks to help to deal with those issues. So like the previous question was asking about chromatographic resolution. That’s one way to deal with nasty matrix. So separating out some of these interferences and one approach. From a mass spec standpoint, we didn’t talk about it today. But there’s a variable called declustering potential, which should be specific to your parent molecule that you can adjust to try to remove some of the things you’re not interested in and keep the eye on that you truly are interested in. In terms of keeping the sensitivity as high as possible. And the last thing I would kind of encourage is, those M RMS likely you’ll see different suppression on different M RMS. So you might want to go ahead and just try even though it might not be the most intense MRM you might experience less suppression on emiram. Last question we have time for today, Karl is around epi methodologies. I have a question on is all the different shoe trap instruments available? Do they all offer epi analysis capabilities? Yep. Yep. Yeah. So if you have a Q trap, you have that functionality. Again, I want to thank you, Karl, for the insightful presentation. I want to thank all of you for spending the last hour with us. We really hope it was informative and insightful for you as you grow your mass spec expertise and knowledge. So again, stay safe, stay healthy. Thanks for joining us, and we’ll see you soon. Bye for now.