Fundamentals of Mass Spectrometry provided by Waters (6 of 7)
This is a transcript of the following video.
Hello, my name is Nick and I work at waters Corporation as a principal analytical scientist. In this short video, we’re going to talk about isotopes.
Isotope Definition #
Isotopes are atoms of an element with normal numbers of protons and electrons, but different numbers of neutrons. Isotopes of the same atomic number, but different mass numbers. The different isotopes of an element have identical chemical properties. The abundance of isotopes is different but known for each element. For example, 98.93% of carbon atoms on Earth, the molecular weight of 12, called carbon 12, and 1.07% have an extra neutron and a molecular weight of 13 or carbon 13. Other elements different relative abundance a number of isotopes. chlorine, for example, has two stable isotopes. 75% of chlorine atoms are chlorine 35, 25% are chlorine 37. Whereas 99.636% of nitrogen atoms and nitrogen 14 and only 0.364% nitrogen 15. And for all intents and purposes, you can assume hydrogen contains only one isotope.
Isotopes Pattern in Mass Spec #
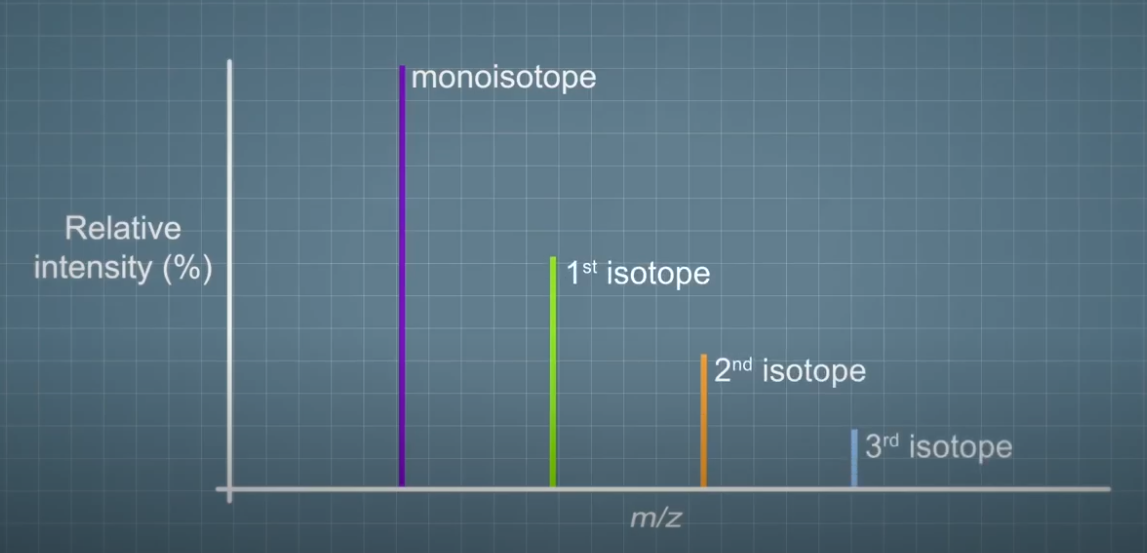 In mass spectrometry, we need to be able to accurately measure the relative amounts of these isotopes, and also be able to predict the ratios based on an elemental formula. The pattern of the different isotopes from a multi-atom species are generally referred to as an isotope pattern. The first peak containing only the lowest mass isotope is referred to as a mono isotope. The next is the first isotope, second isotope, etc. Prediction of an isotope pattern from a given elemental composition at first sight seems straightforward.
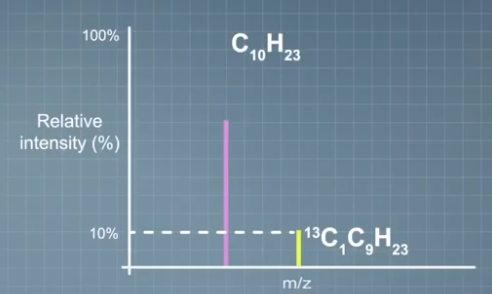 For example, take a molecule of decane consisting of 10 carbons and 23 hydrogens. We know the percentage of heavy isotope of carbon carbon 13 is 1.07% and zero isotopes of hydrogen. If we have one carbon, the relative height the first isotope would be 1.07%. For two carbon, it will be 2.14%, etc. So the relative height of the first isotope for molecule with 10 carbons will be 10 times 1.07%, or 10.7%.
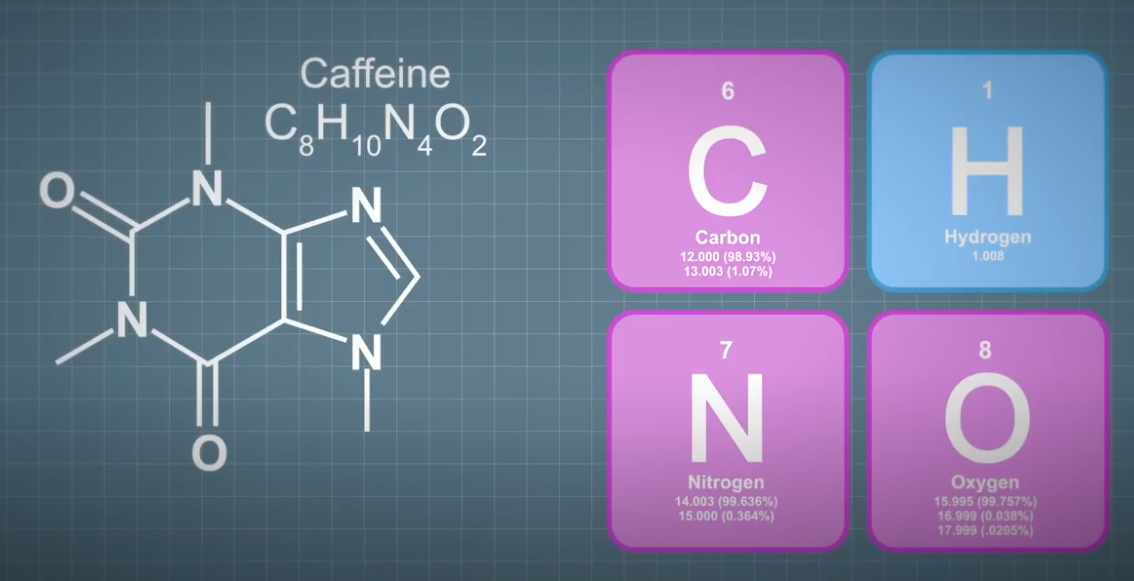 When you start to consider prediction of the further isotopes, it gets complicated quickly, and even for single element species with only two isotopes like hydrocarbons. When you consider a relatively simple organic molecule such as caffeine, the prediction of the isotope pattern involves long multinomial calculations. Unless you're a glutton for complex math problems, many software based solutions are freely available, and the first choice for most mass spectrometrists. If you were to consider the carbon isotopes in the prediction of the isotope pattern for caffeine, first, second, and third isotopes will be 8.6%, 0.32%, and 0.007%, respectively.
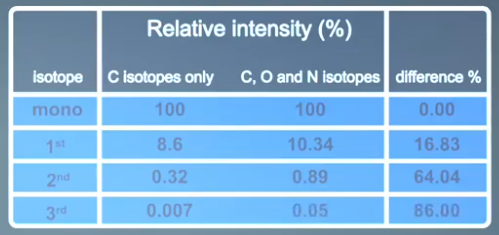 However, an accurate calculation using isotopes of carbon, oxygen and nitrogen predicts them to be at 10.34%, 0.89%, and 0.05%. This highlights the way we can use the isotope patterns in mass spectrometry. With all mass spectrometry we are either trying to identify a species or confirm what we think it is. By using the information encoded in the isotope pattern, we can make assumptions about the number and the types of atoms that are present. In a simplified example, if the first isotope is 16%, then we can reasonably assume 12 to 15 carbons are present. If the first isotope is significantly lower or higher than this, the assumption cannot be true. Heteroatoms like chlorine and bromine give rise to very distinct patterns that can further aid in interpretation.
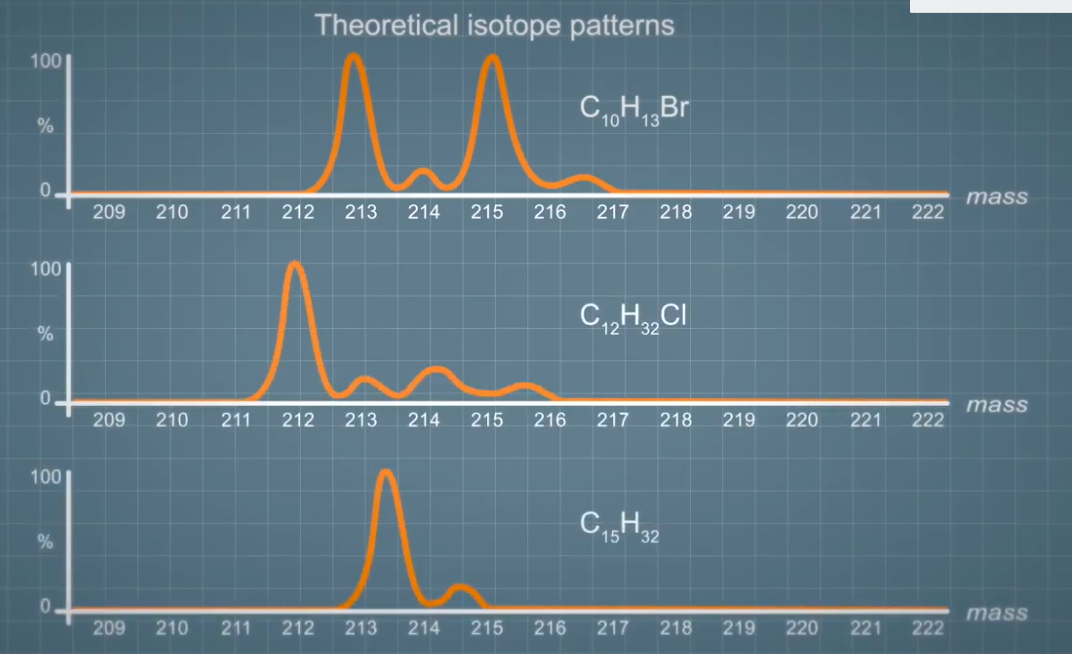 For example, here, some theoretical isotope patterns for chlorine and bromine containing compounds, compared to a carbon only. Given the complexity of organic systems and a number of combination of elements, 1000s of compounds can have the same mass. For any compound the elemental composition can be used to generate a theoretical isotope pattern, which can be compared to an acquired spectrum. This can, for example, enable us to distinguish between two compounds at the same mass but different elements or compositions. The predicted isotope pattern for chloramphenicol, chlorine containing antibiotic, is very different to that of a compound with the same `m over z` found in the background sample like urine.
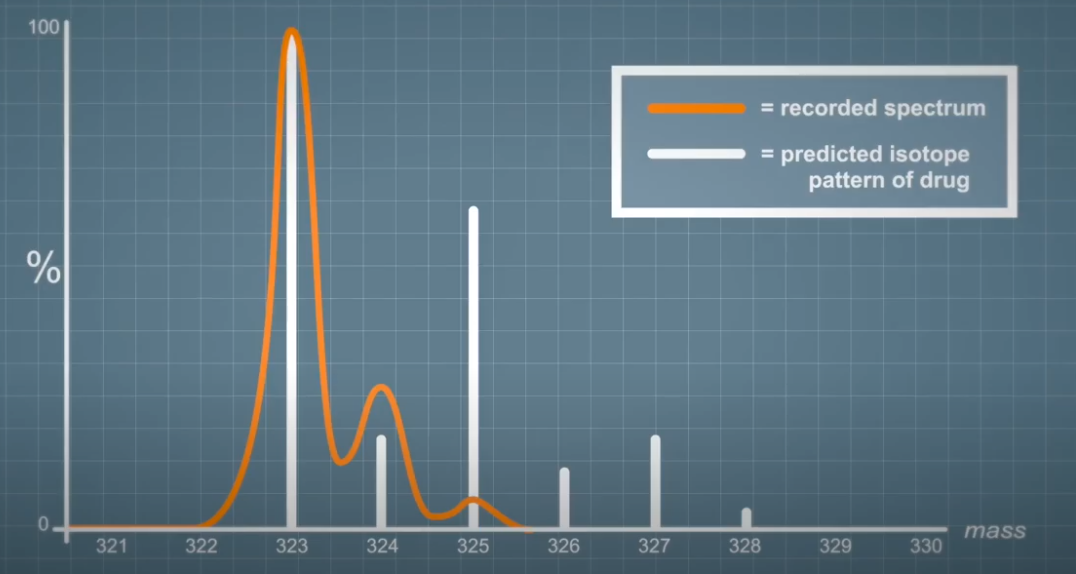 Here we can see the predicted isotope pattern of chloramphenicol compared to a spectrum recorded from a compound with exactly the same amount monoisotopic `m over z`. We can use this information to ensure we're measuring the drug during an assay rather than a background endogenous species. This is an extreme case to illustrate the point, but software can be used to differentiate much subtler differences.